Annual Plots
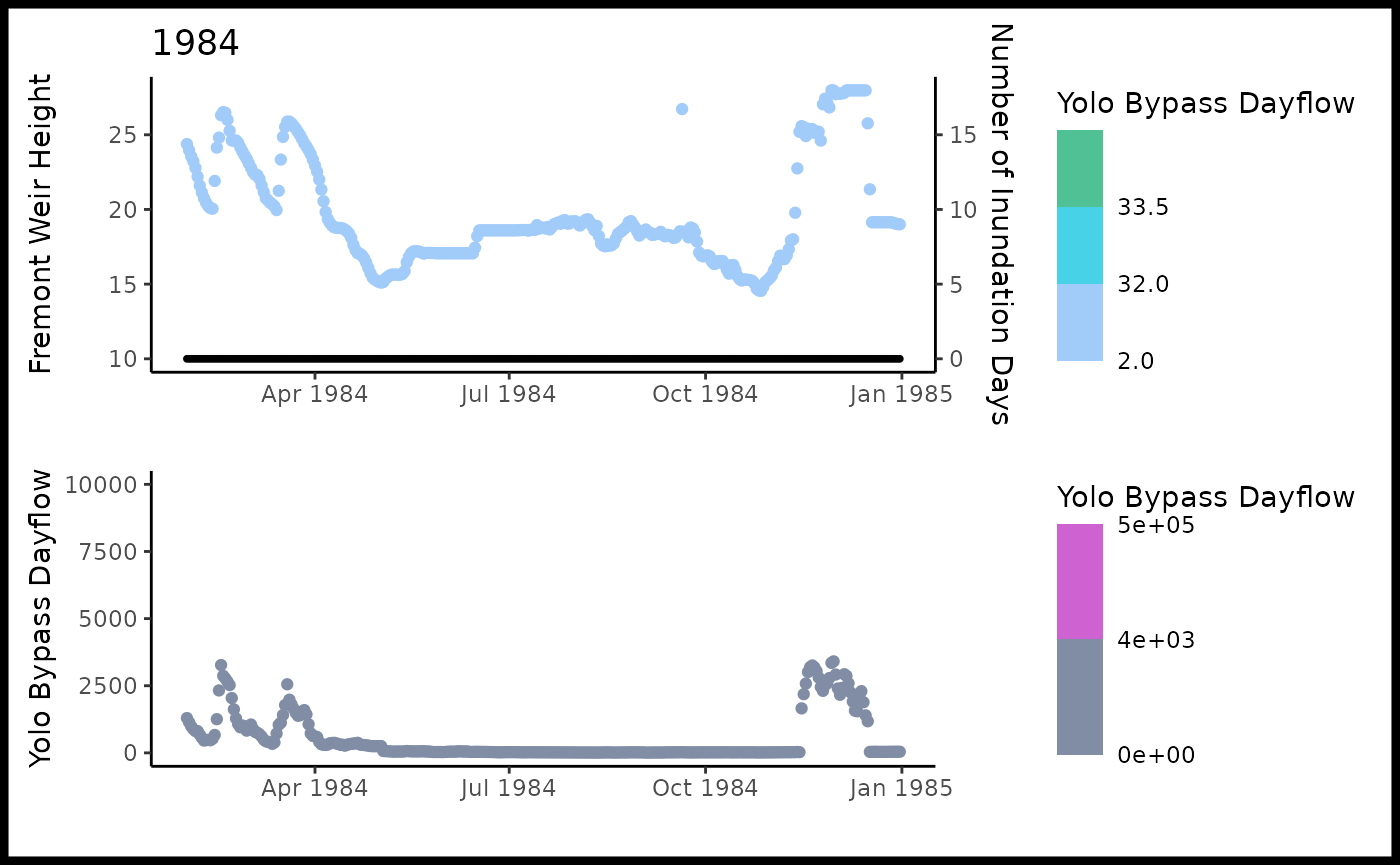
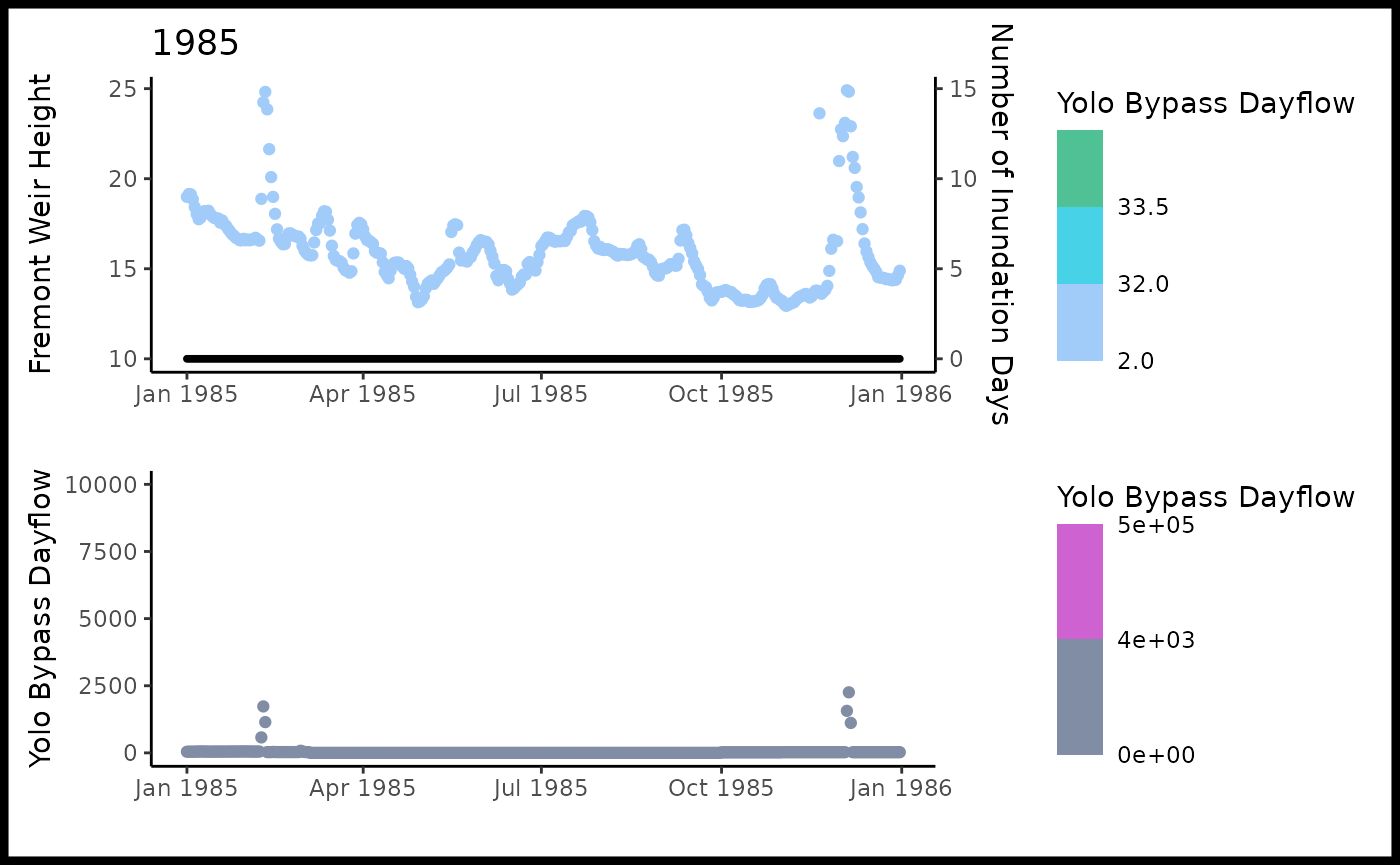
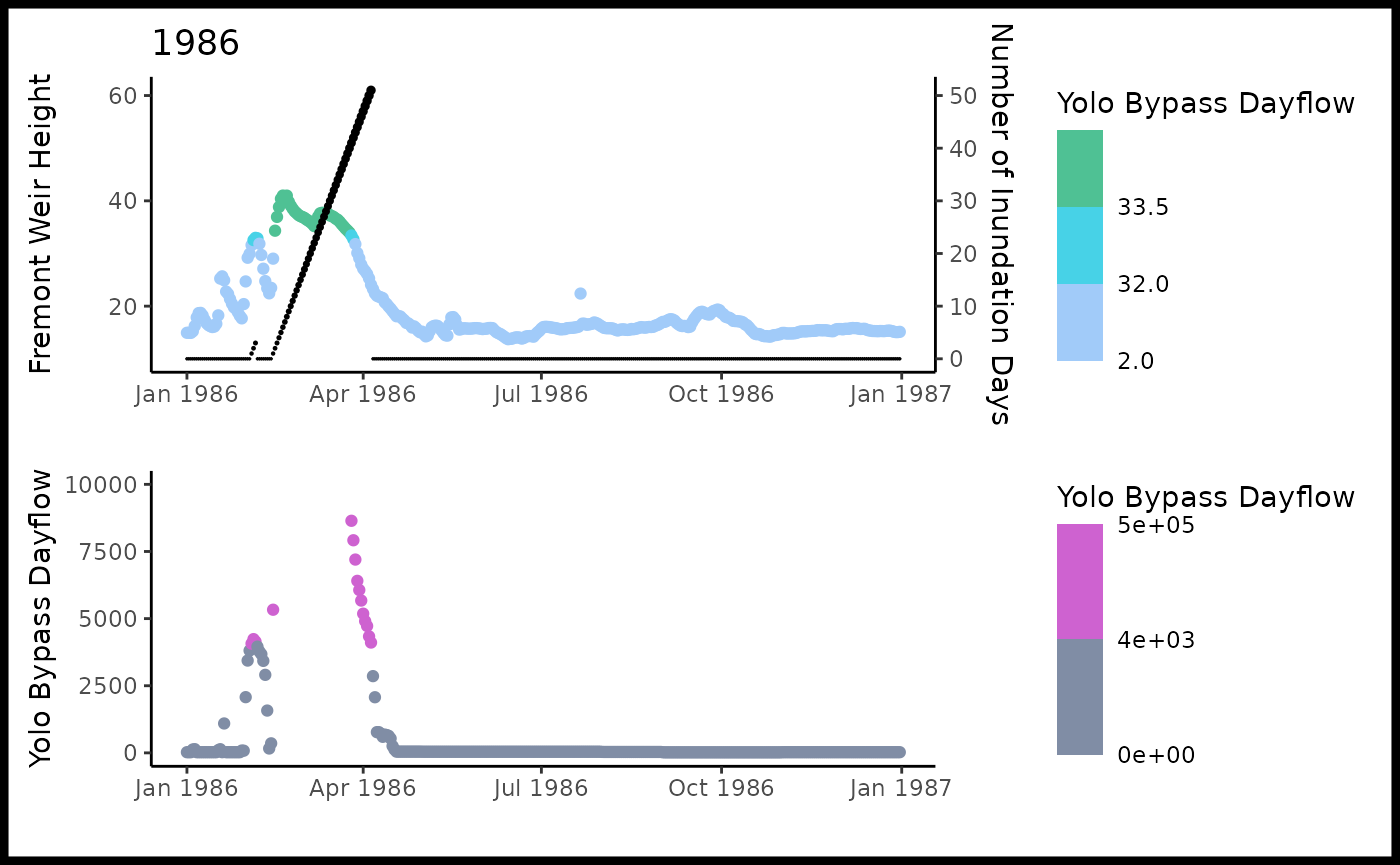
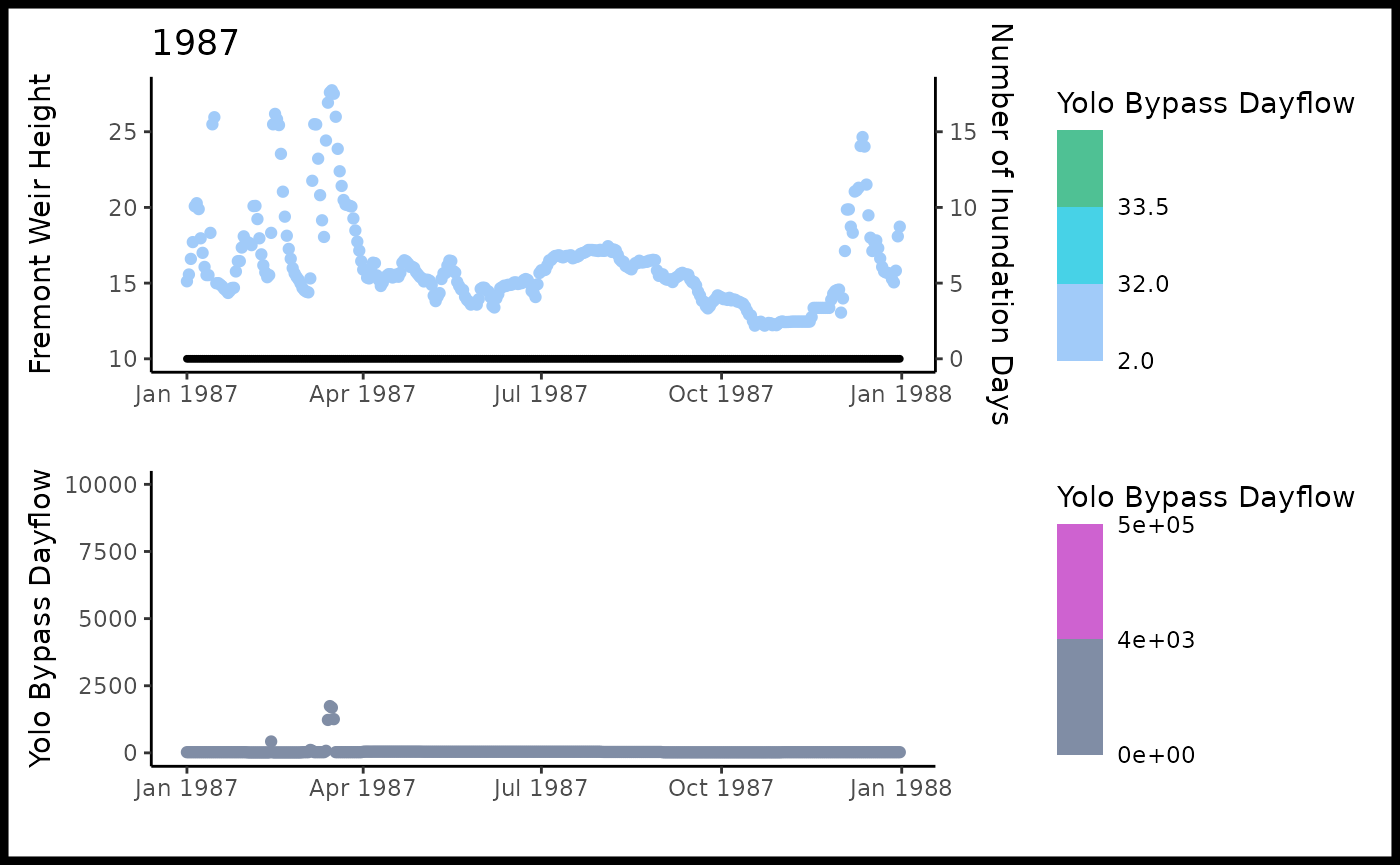
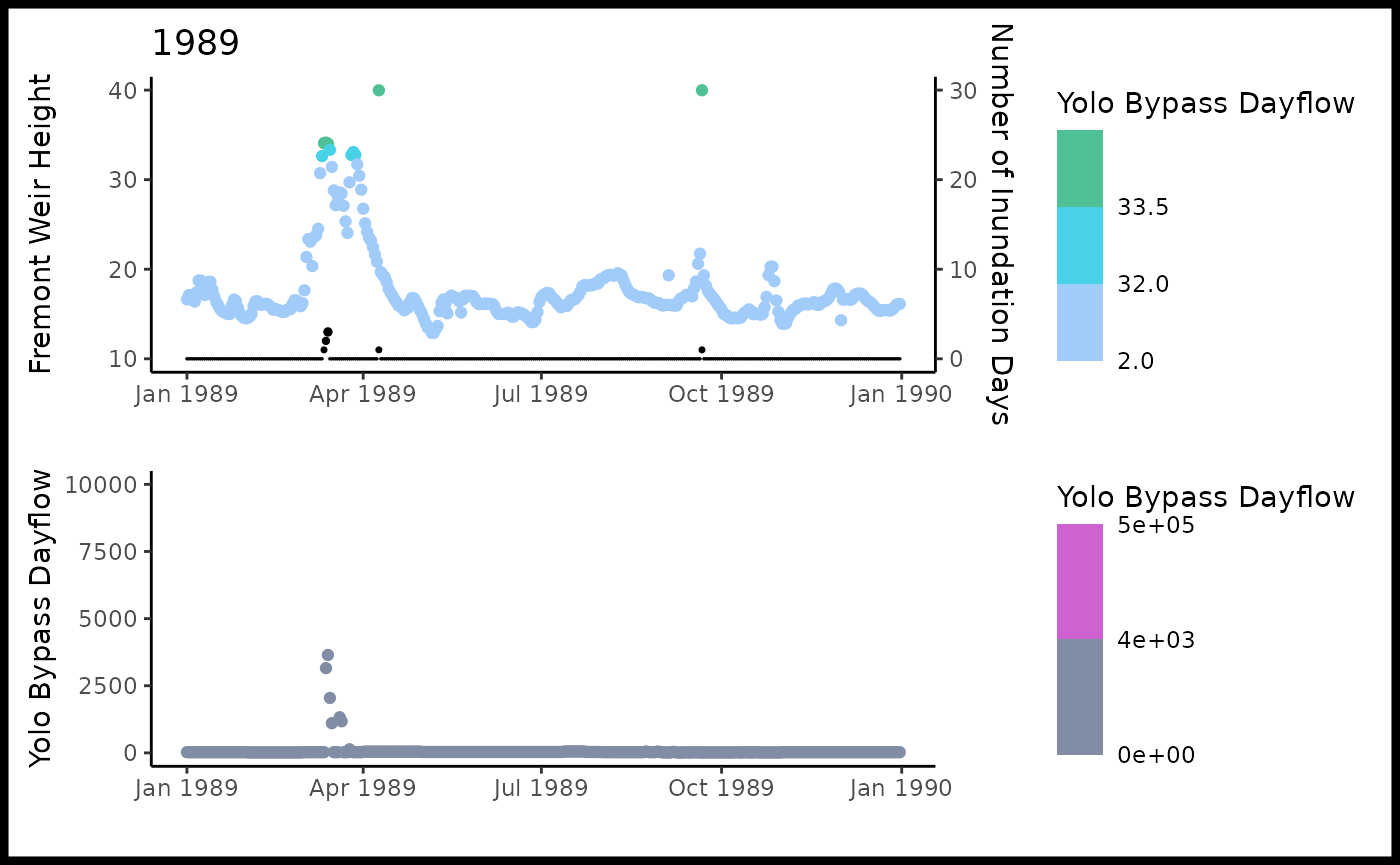
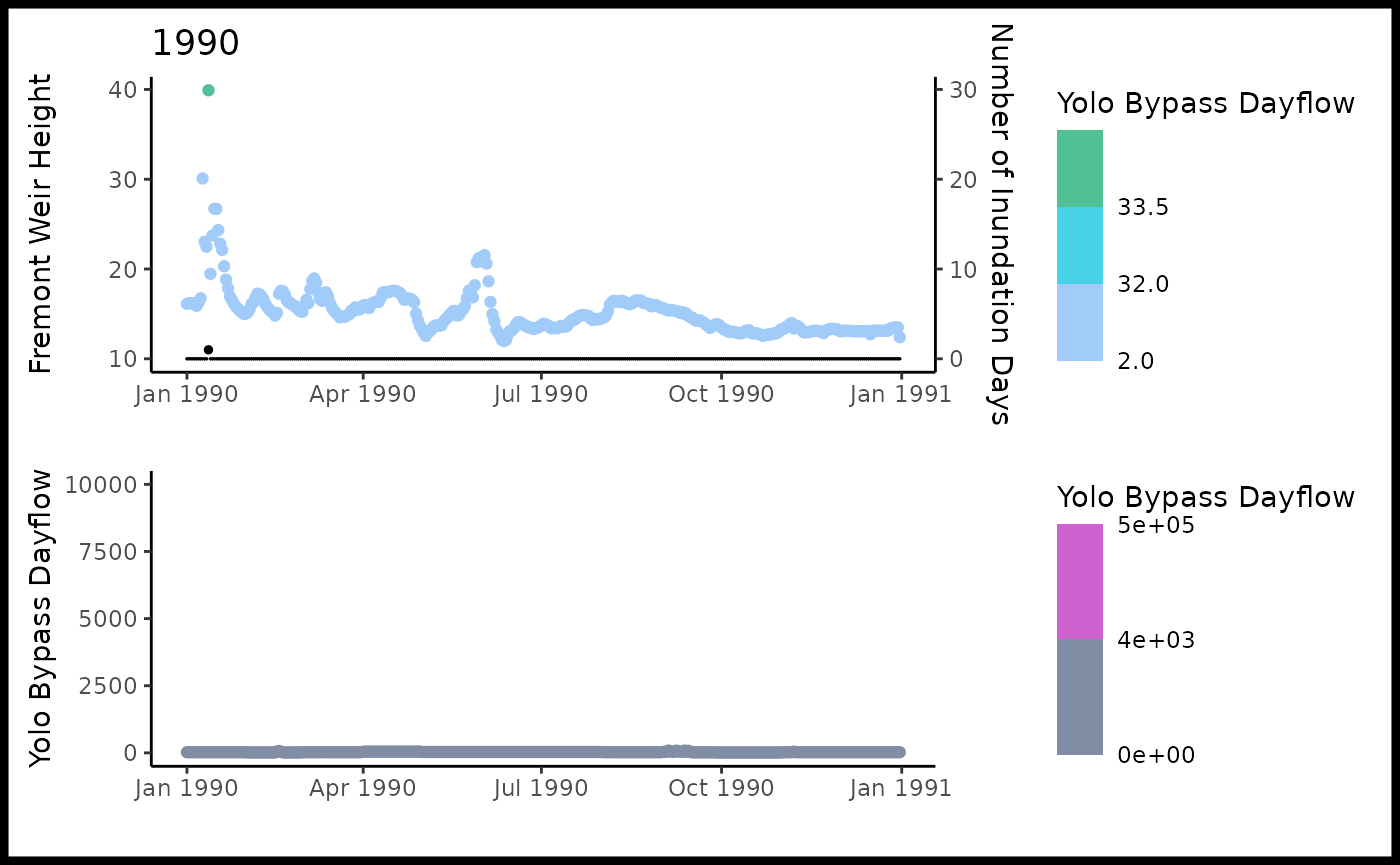
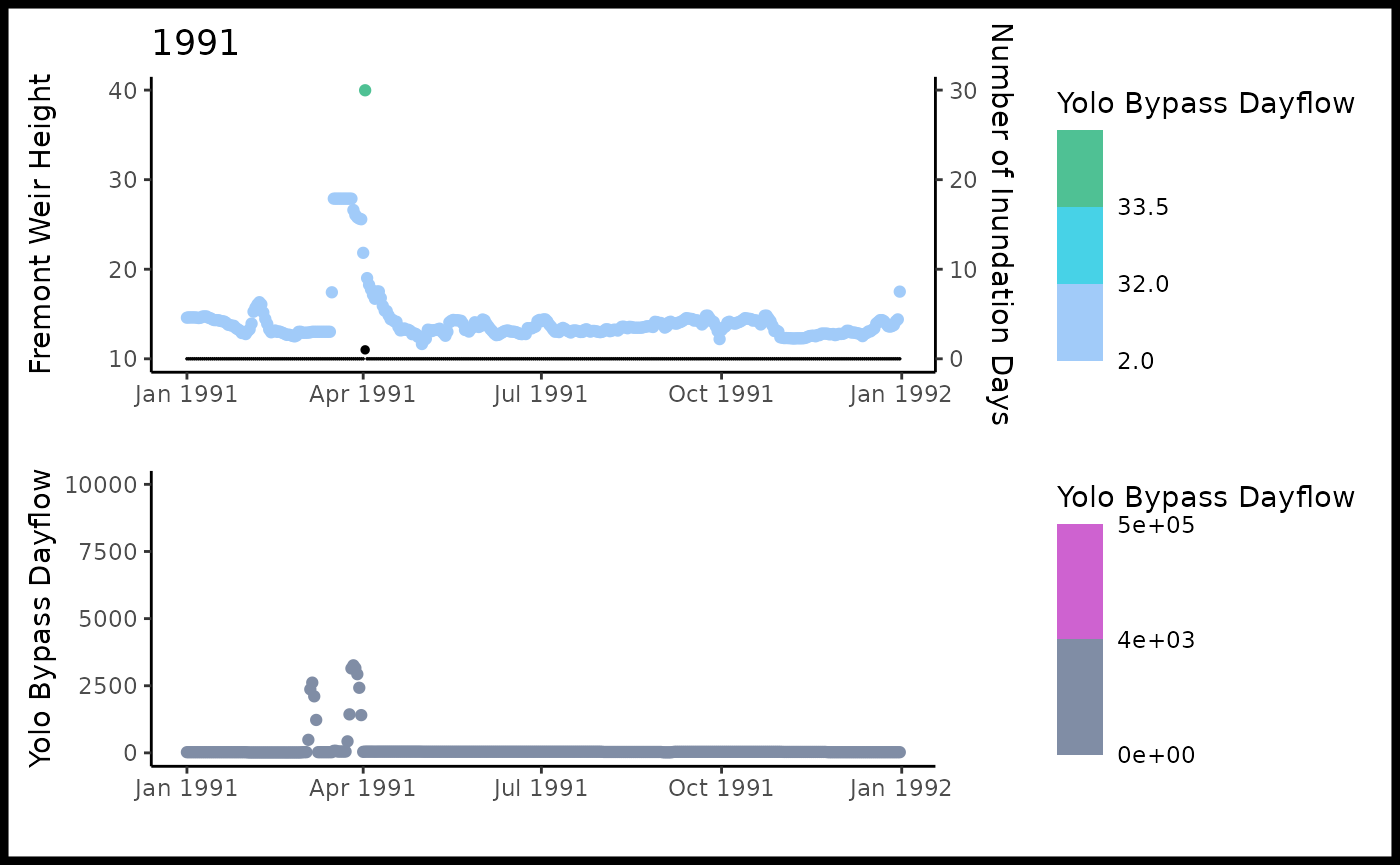
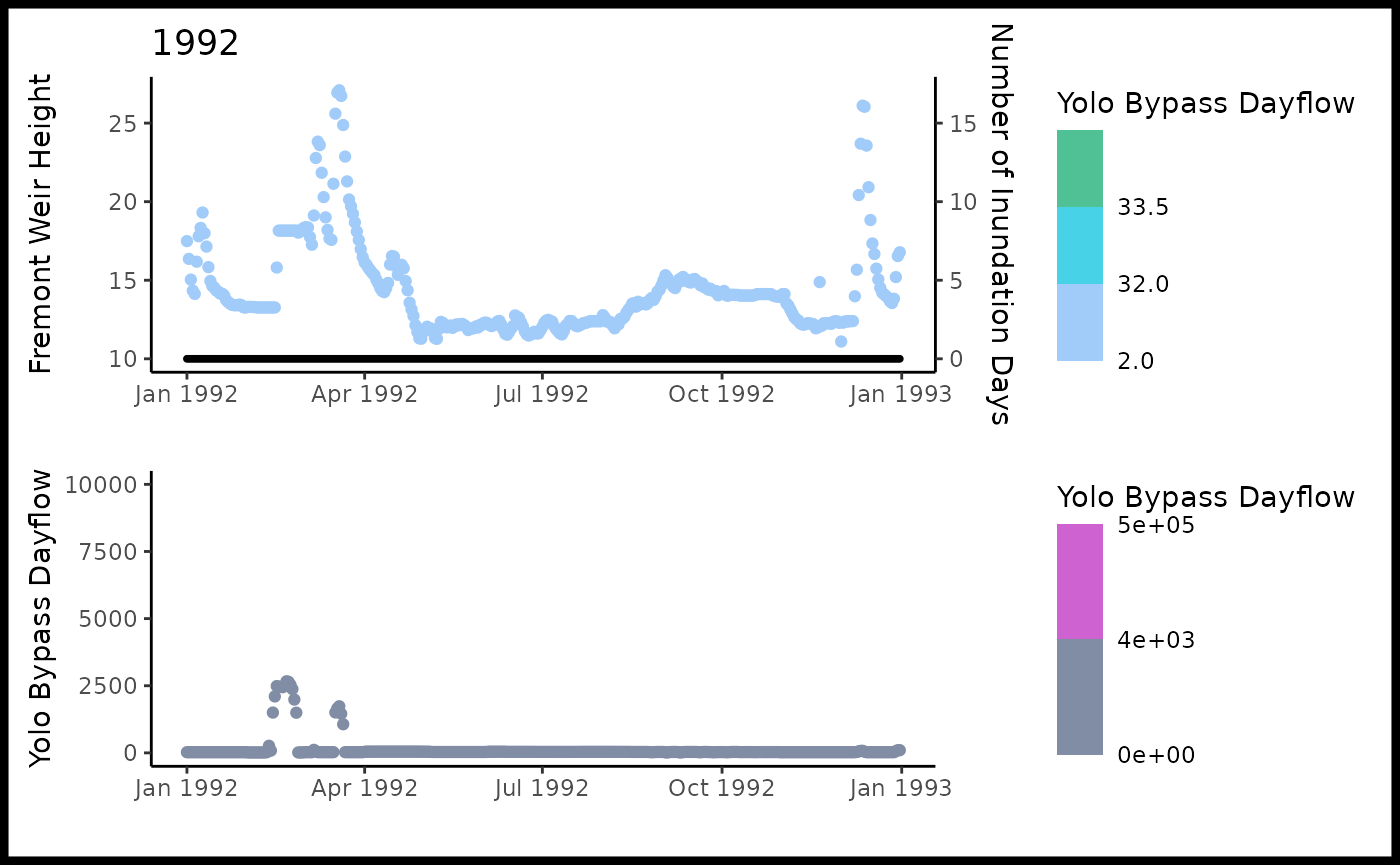
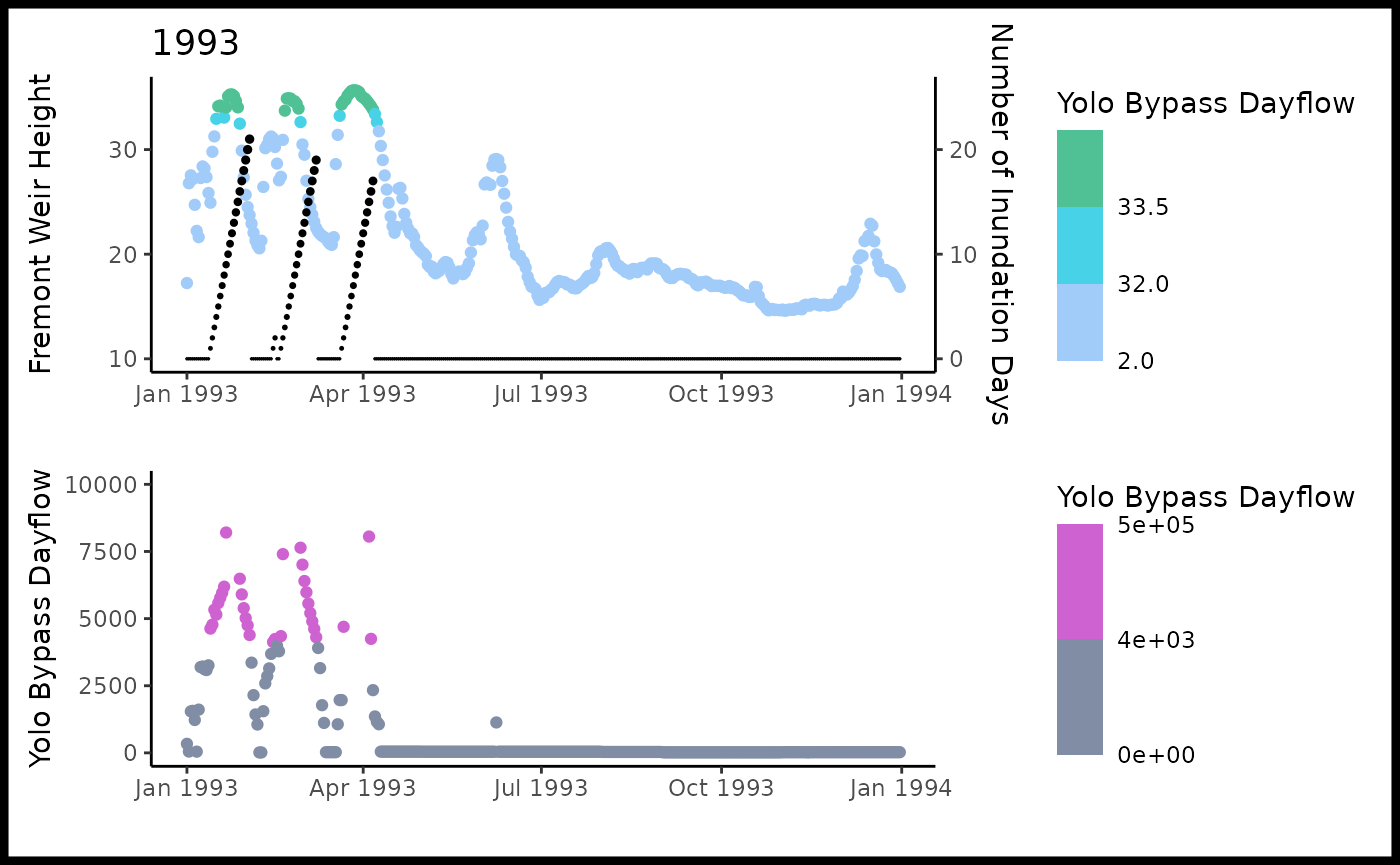
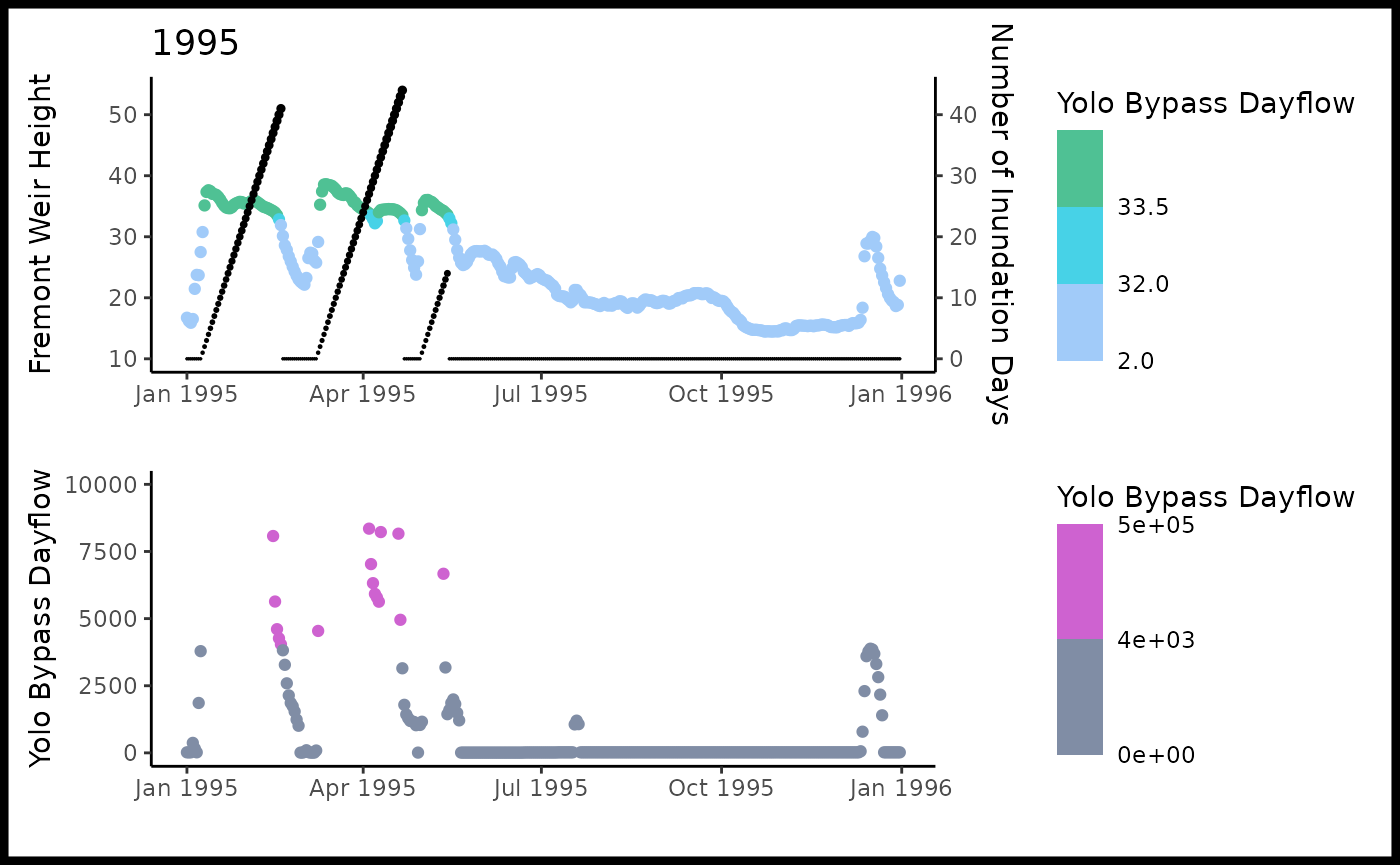
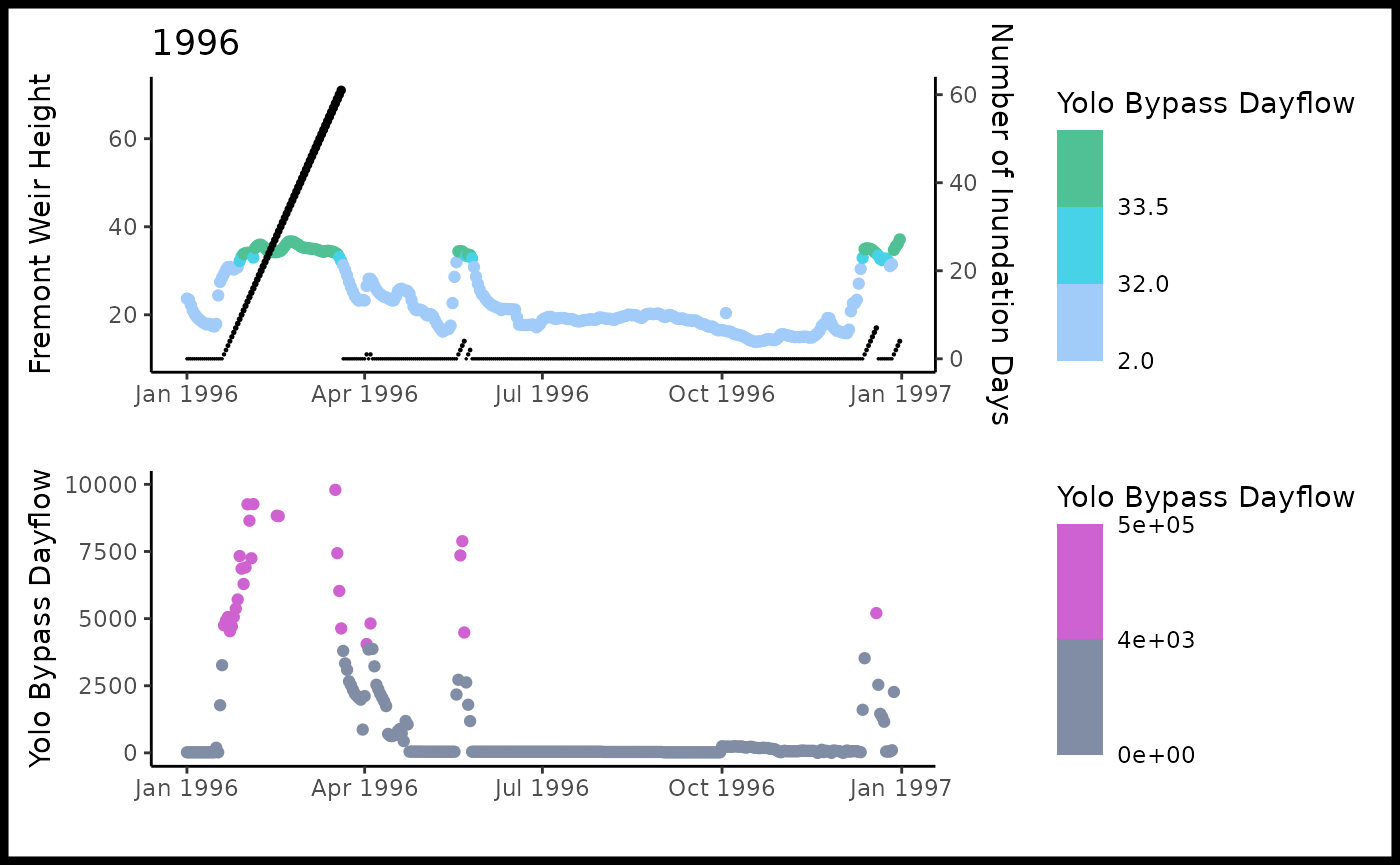
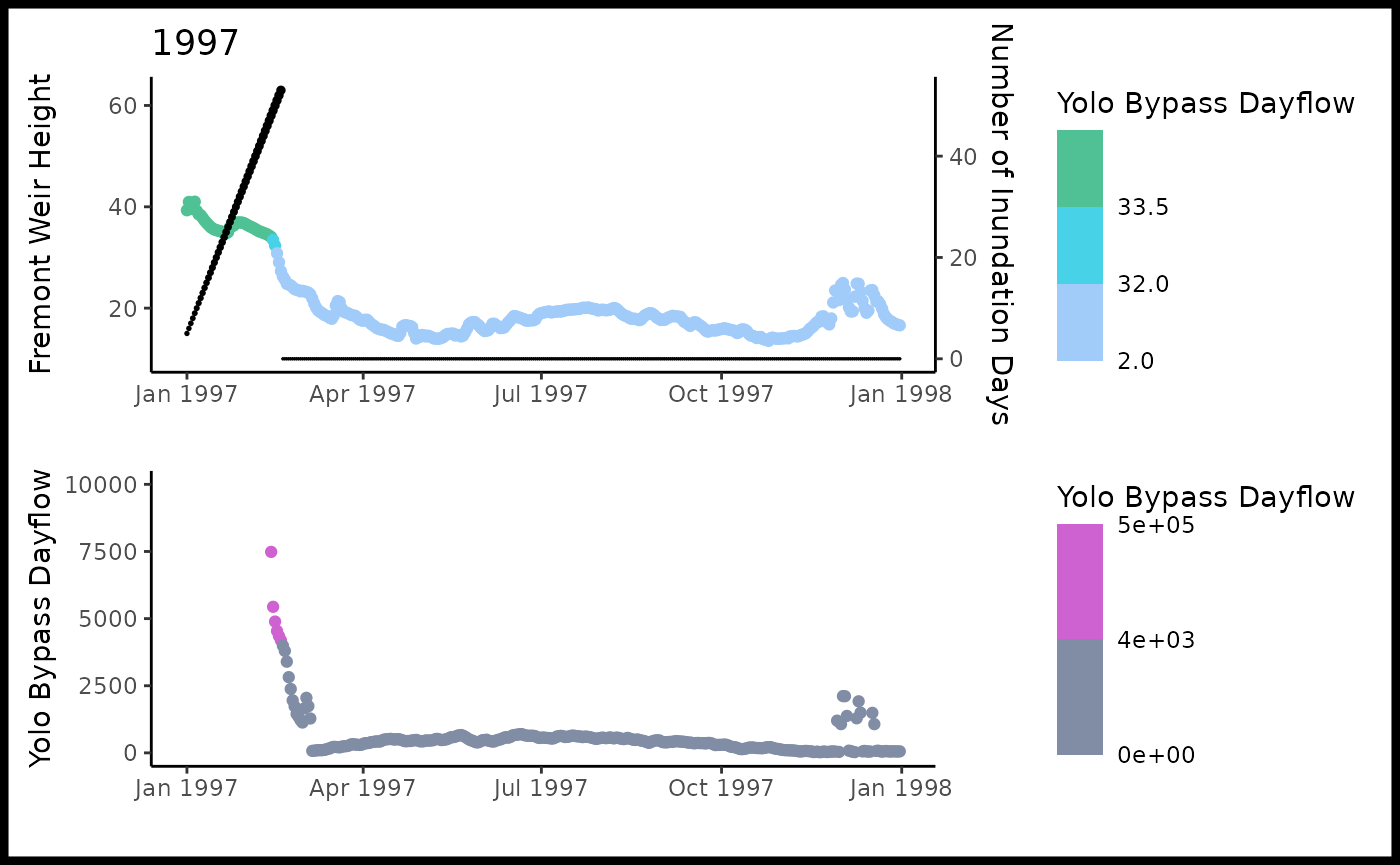
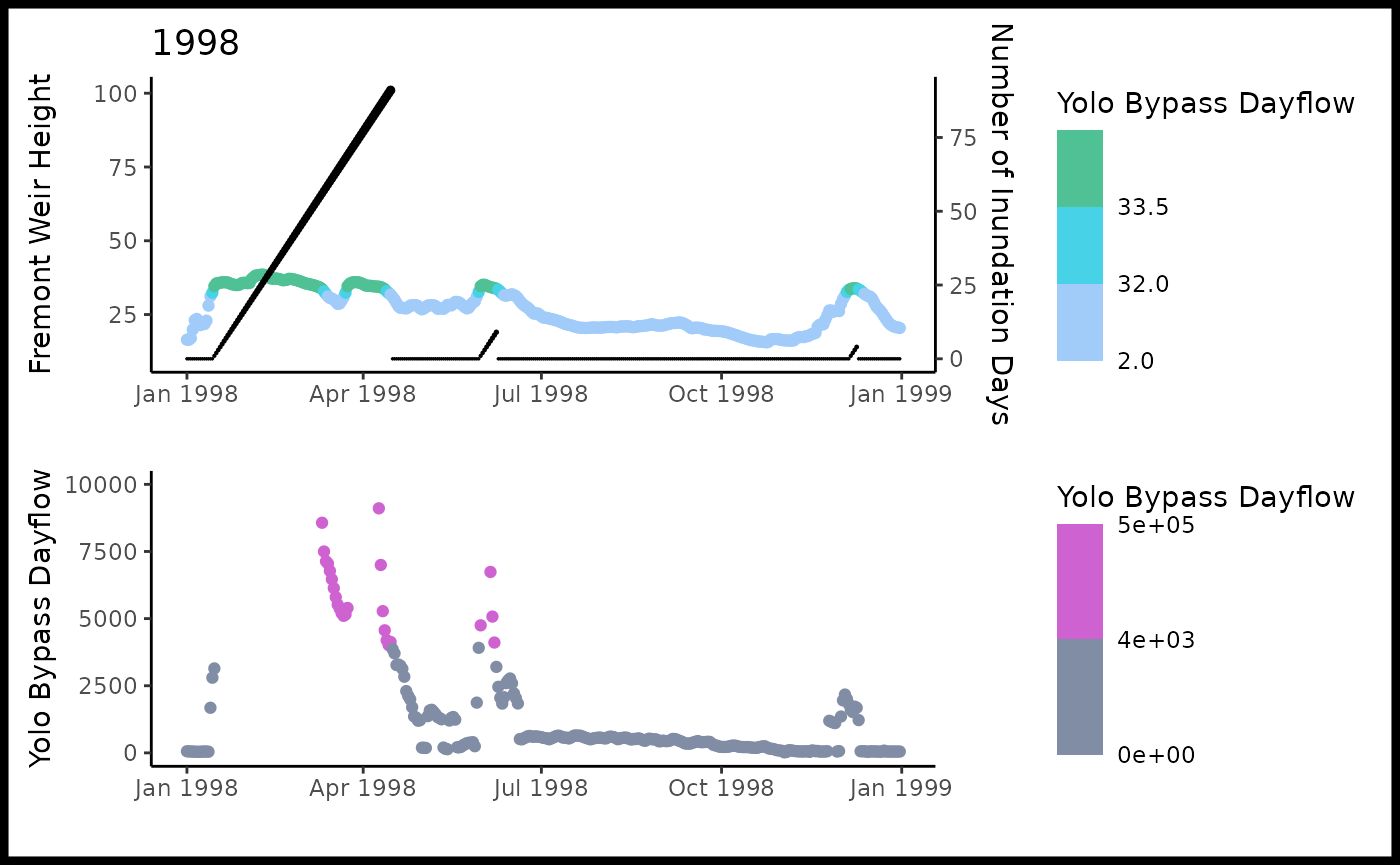
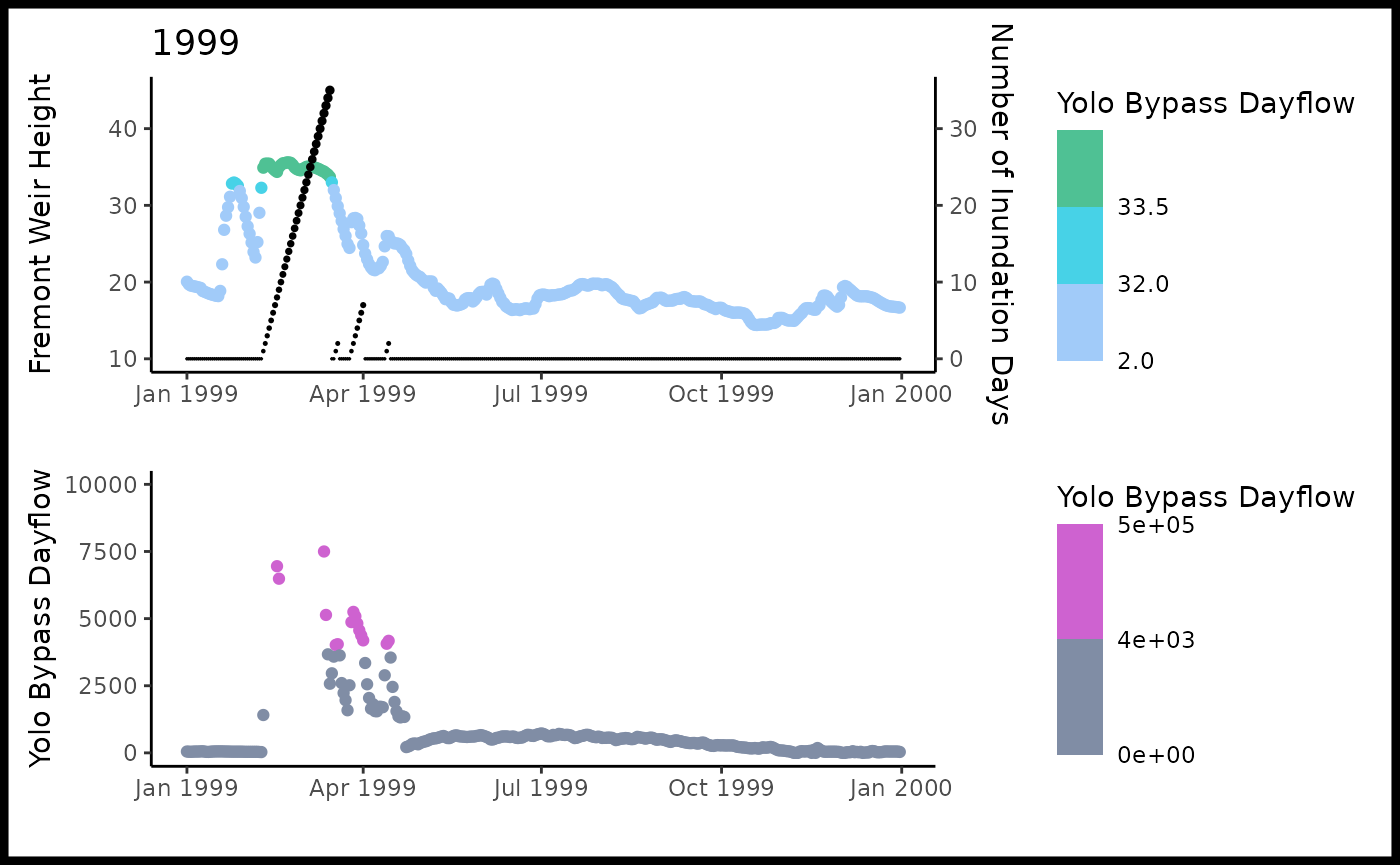
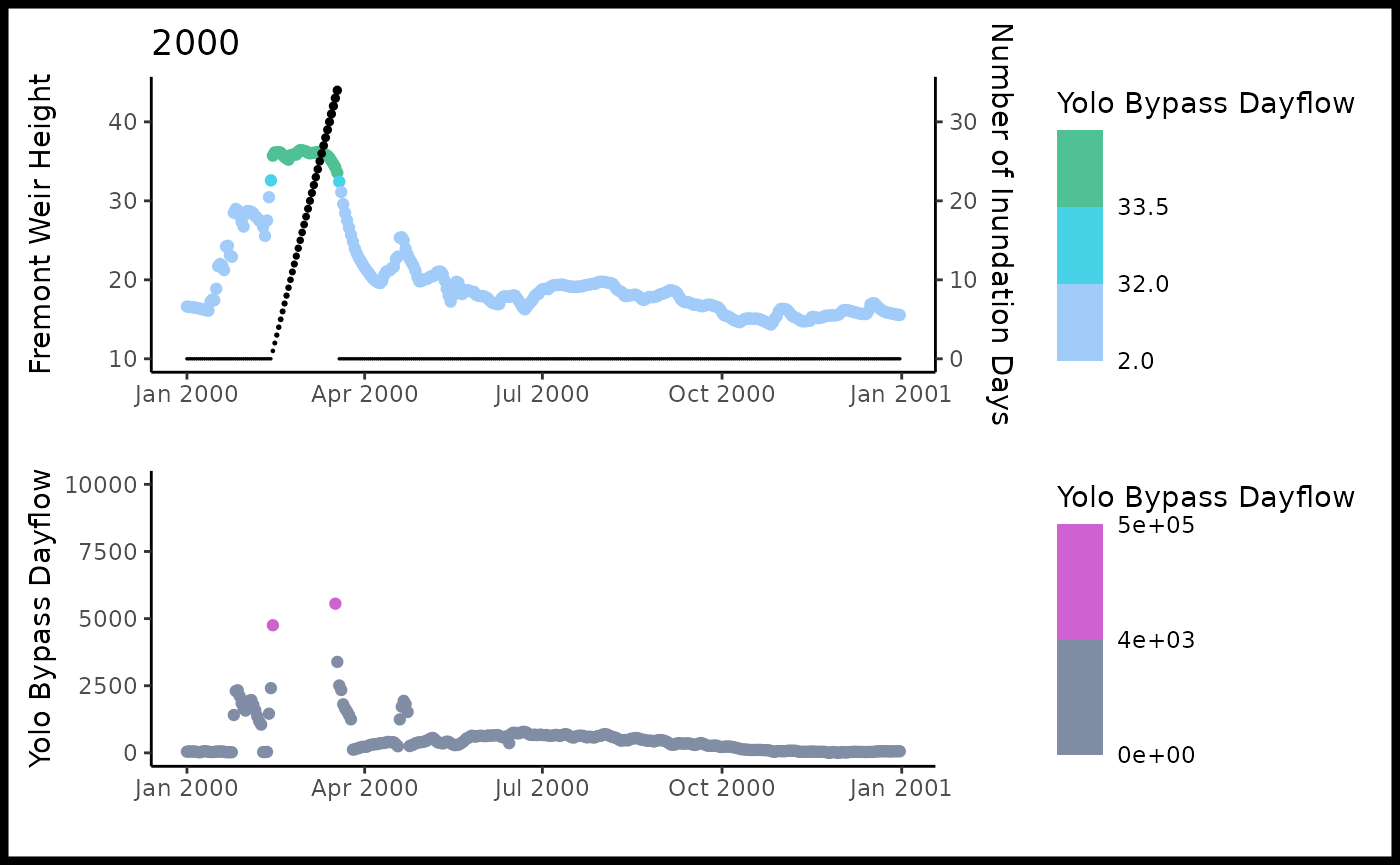
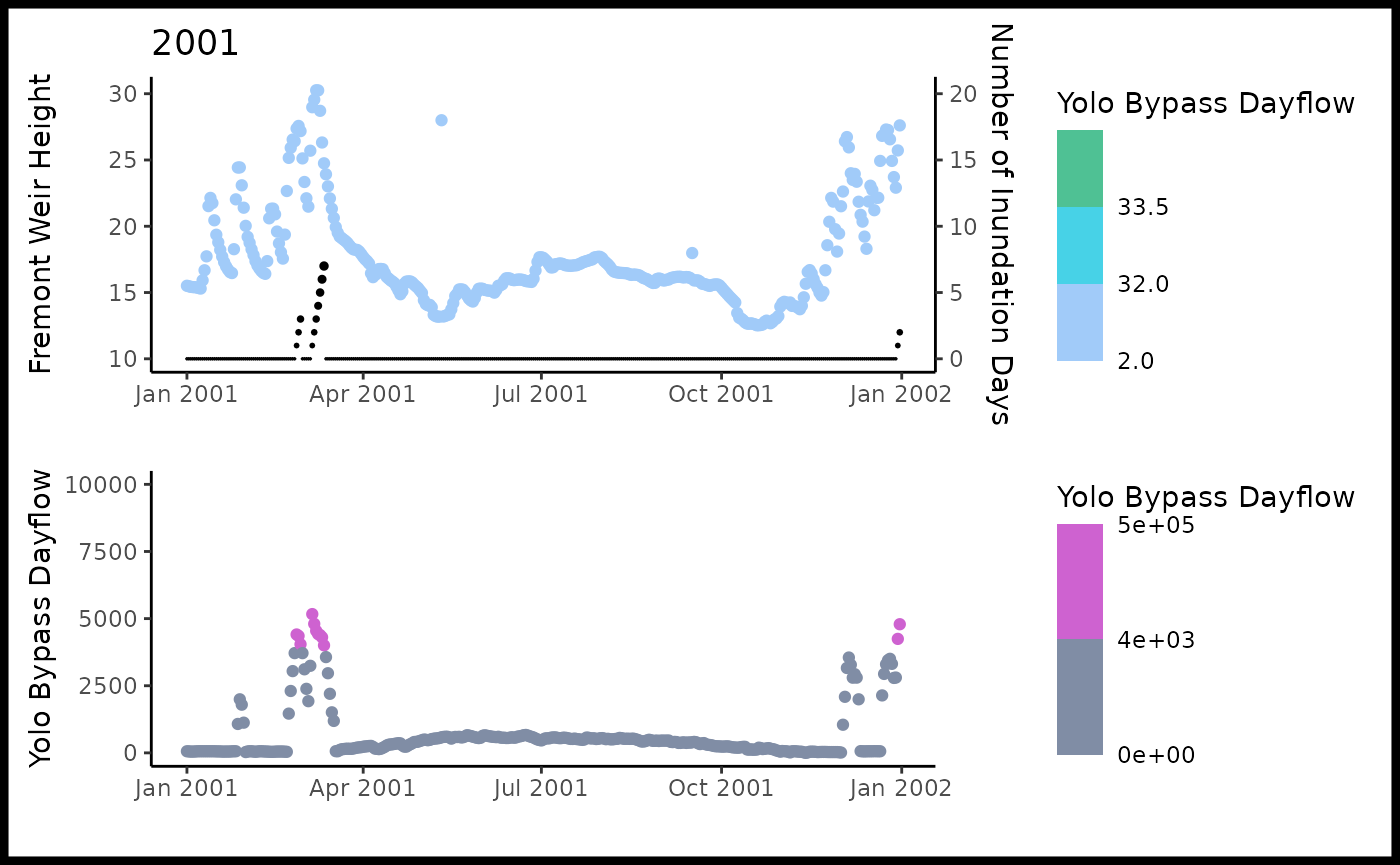
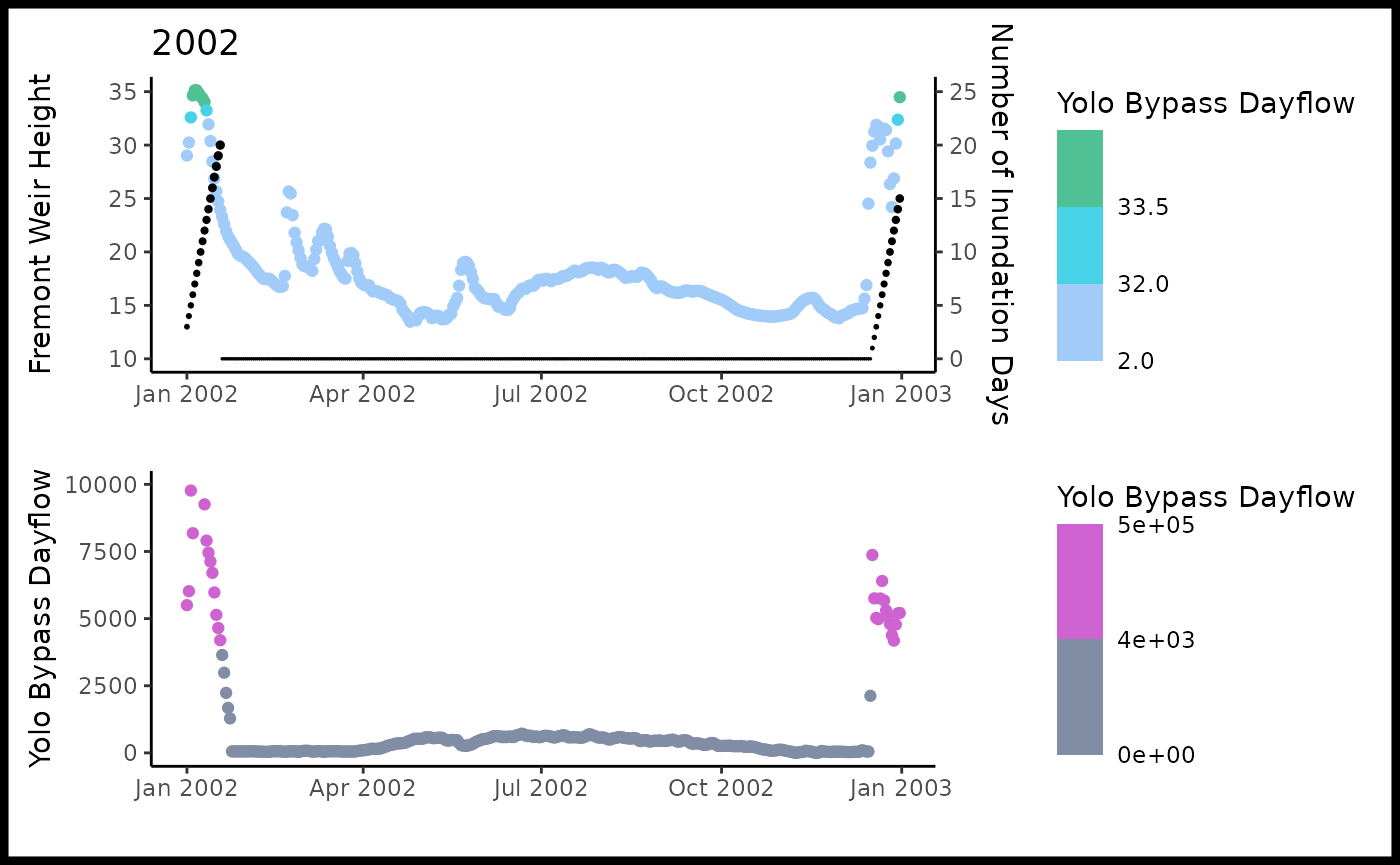
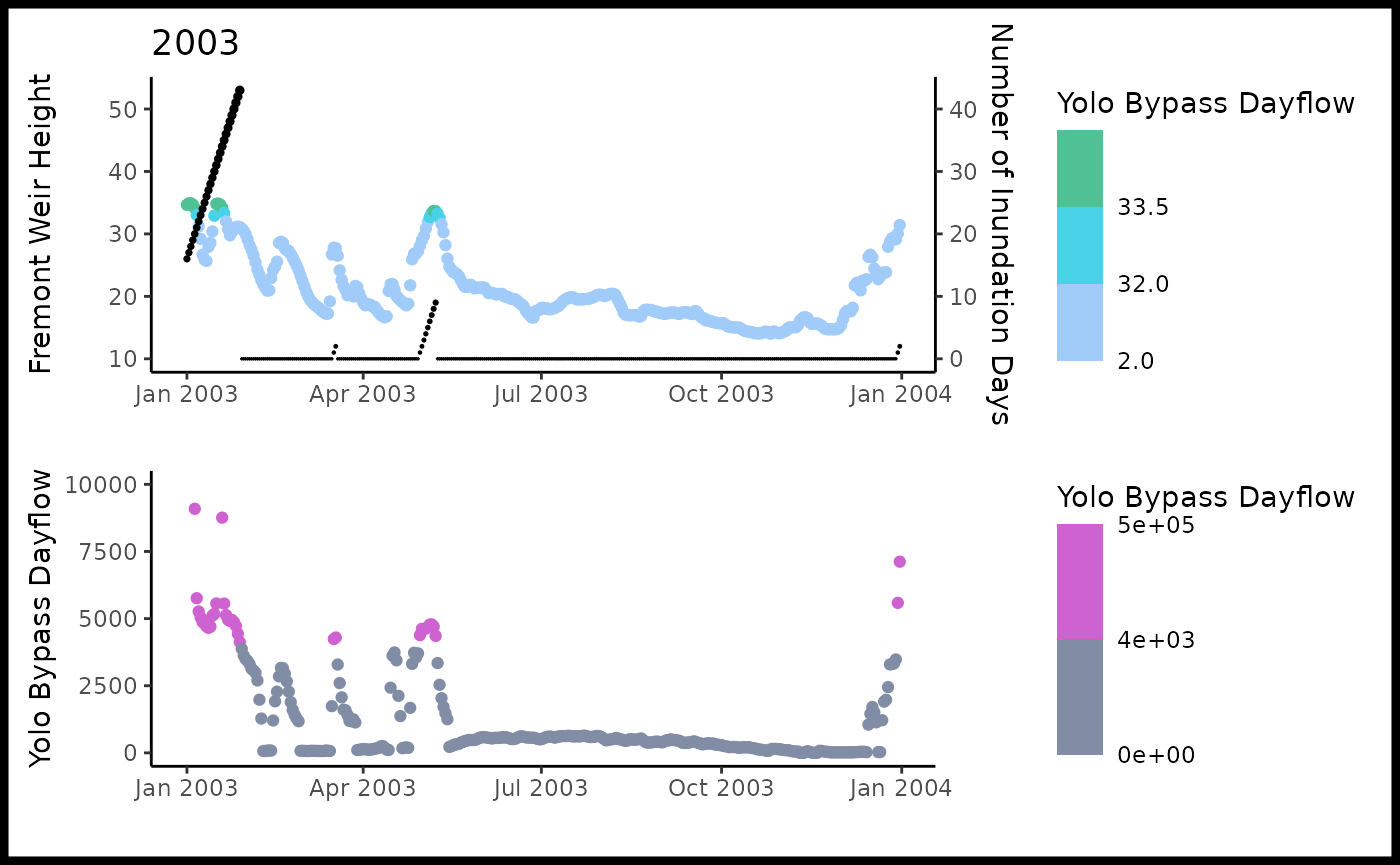
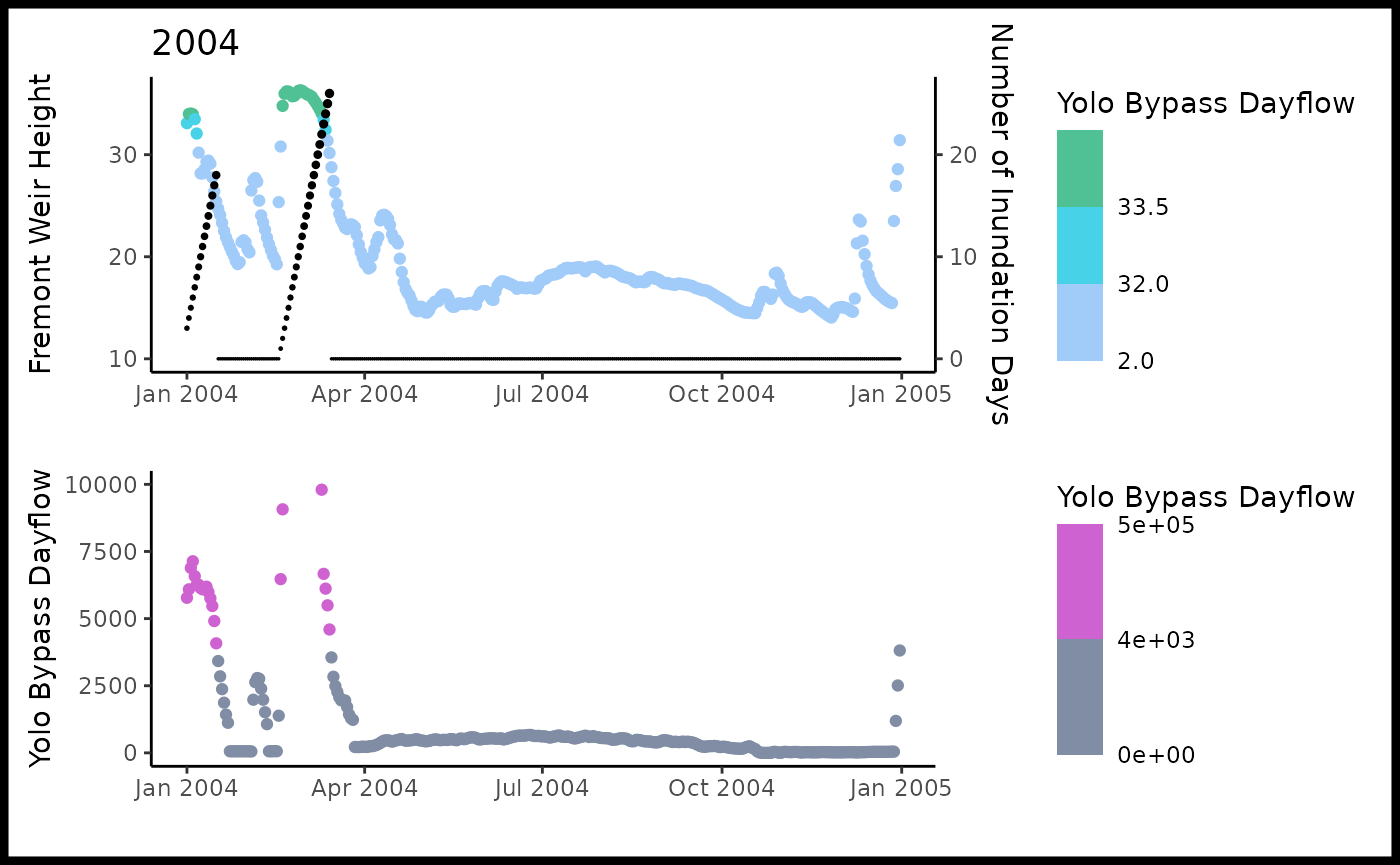
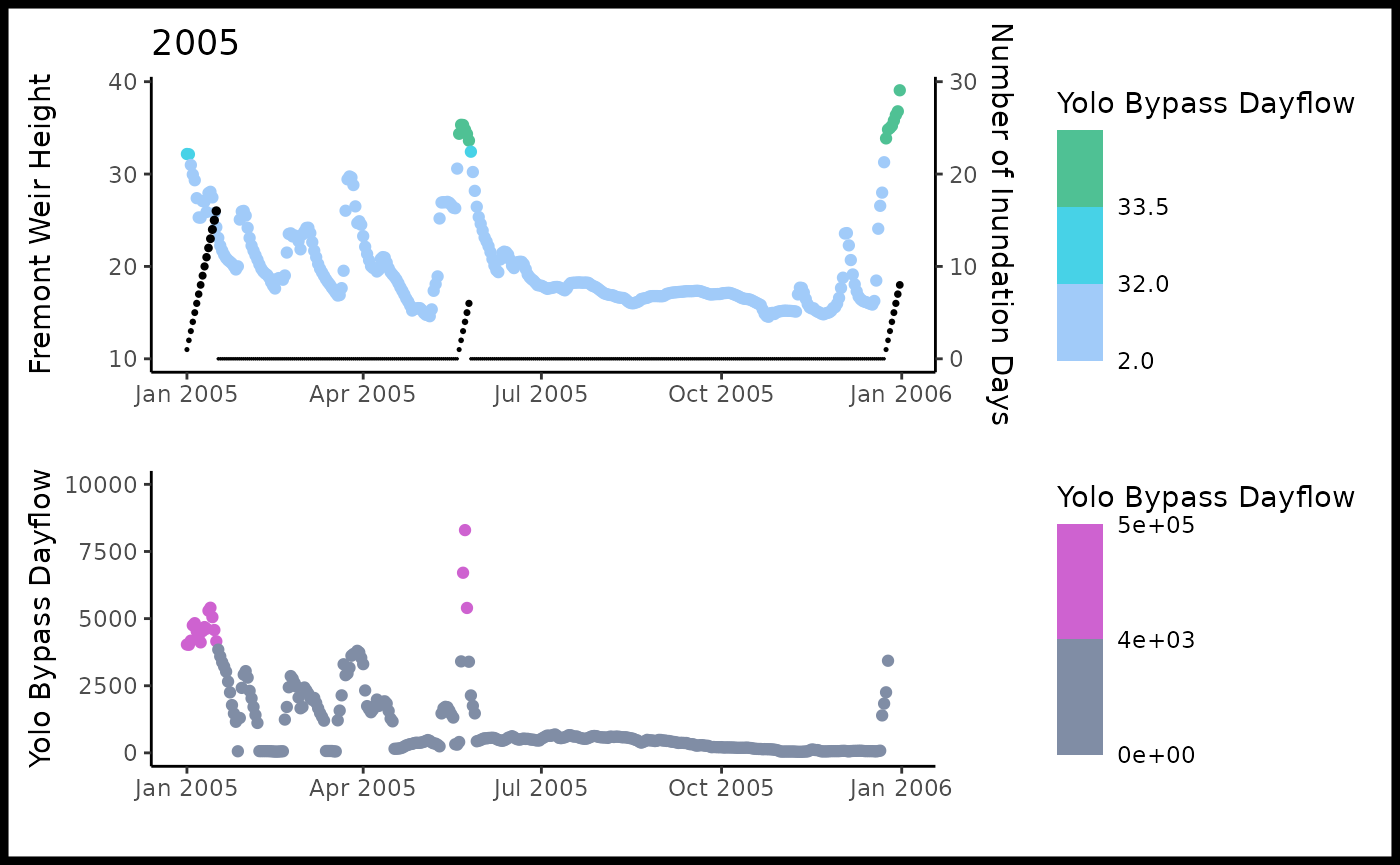
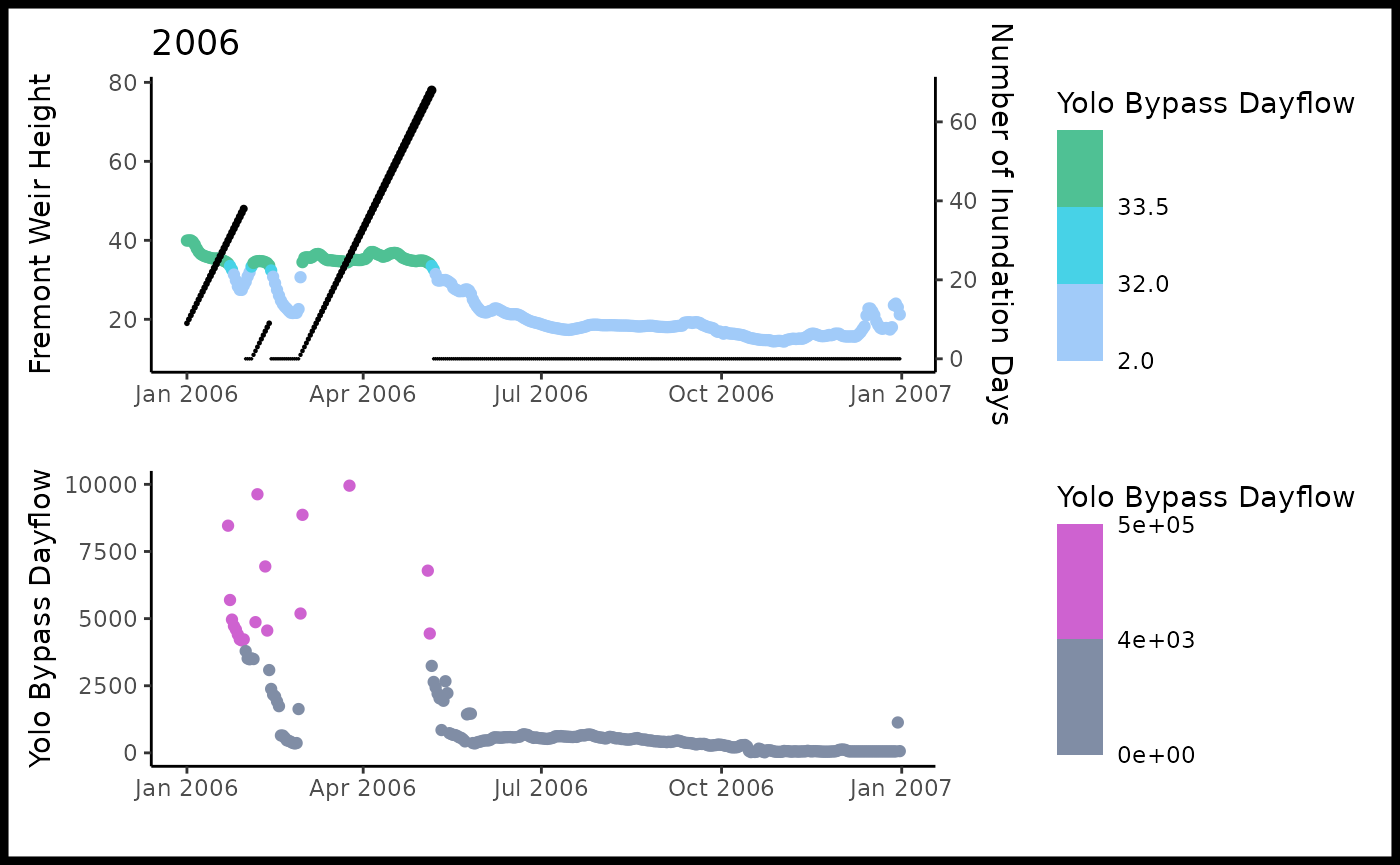
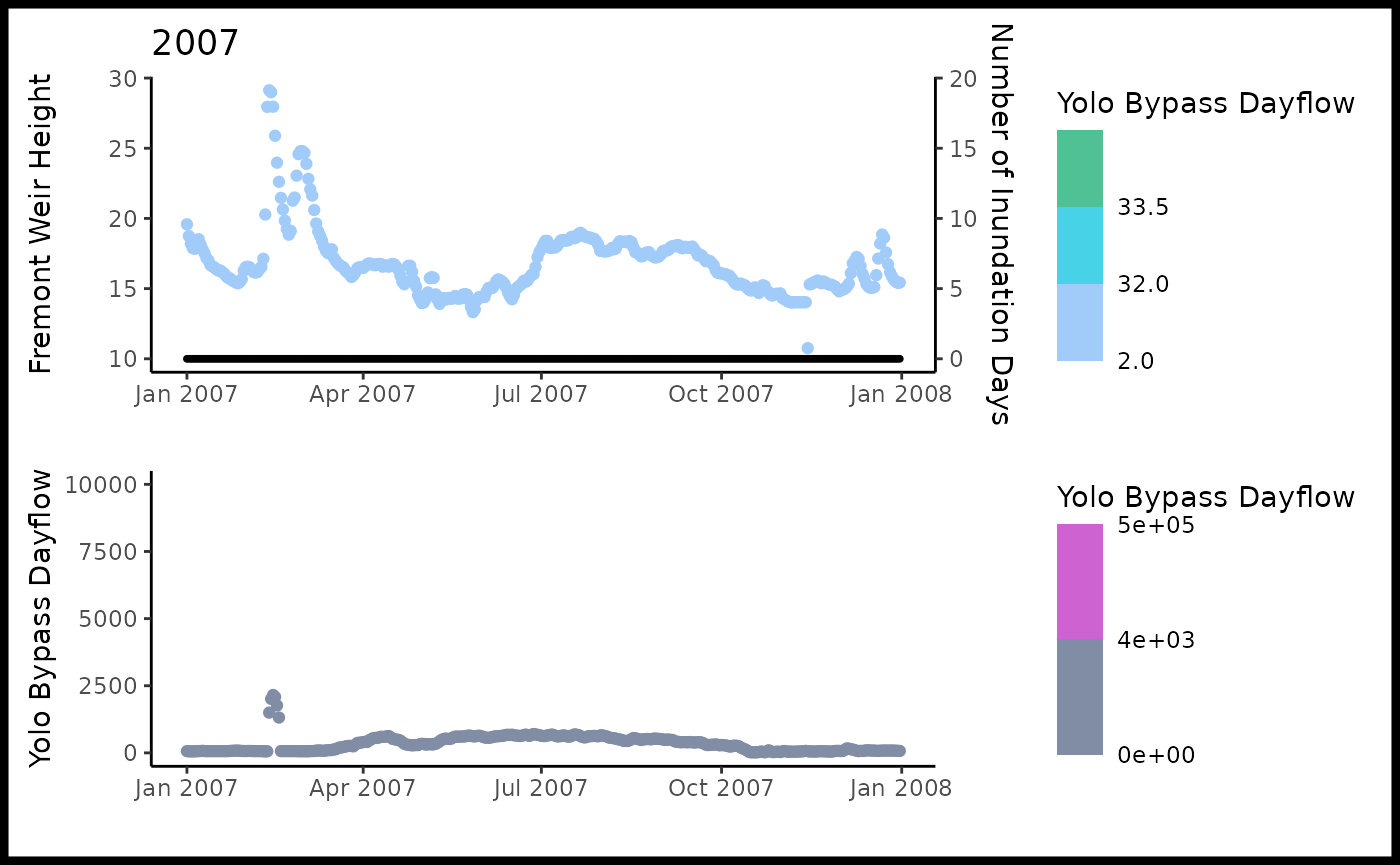
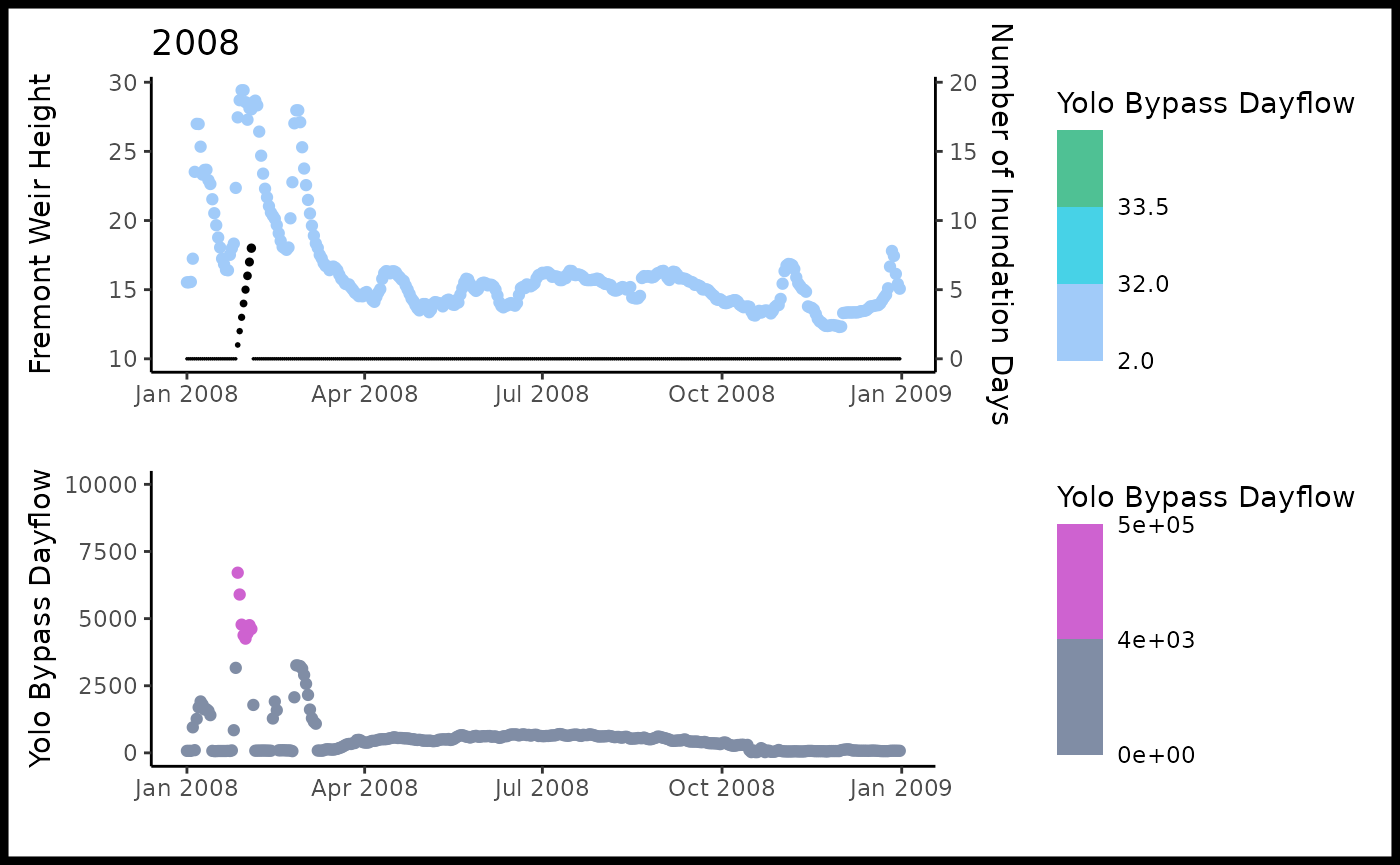
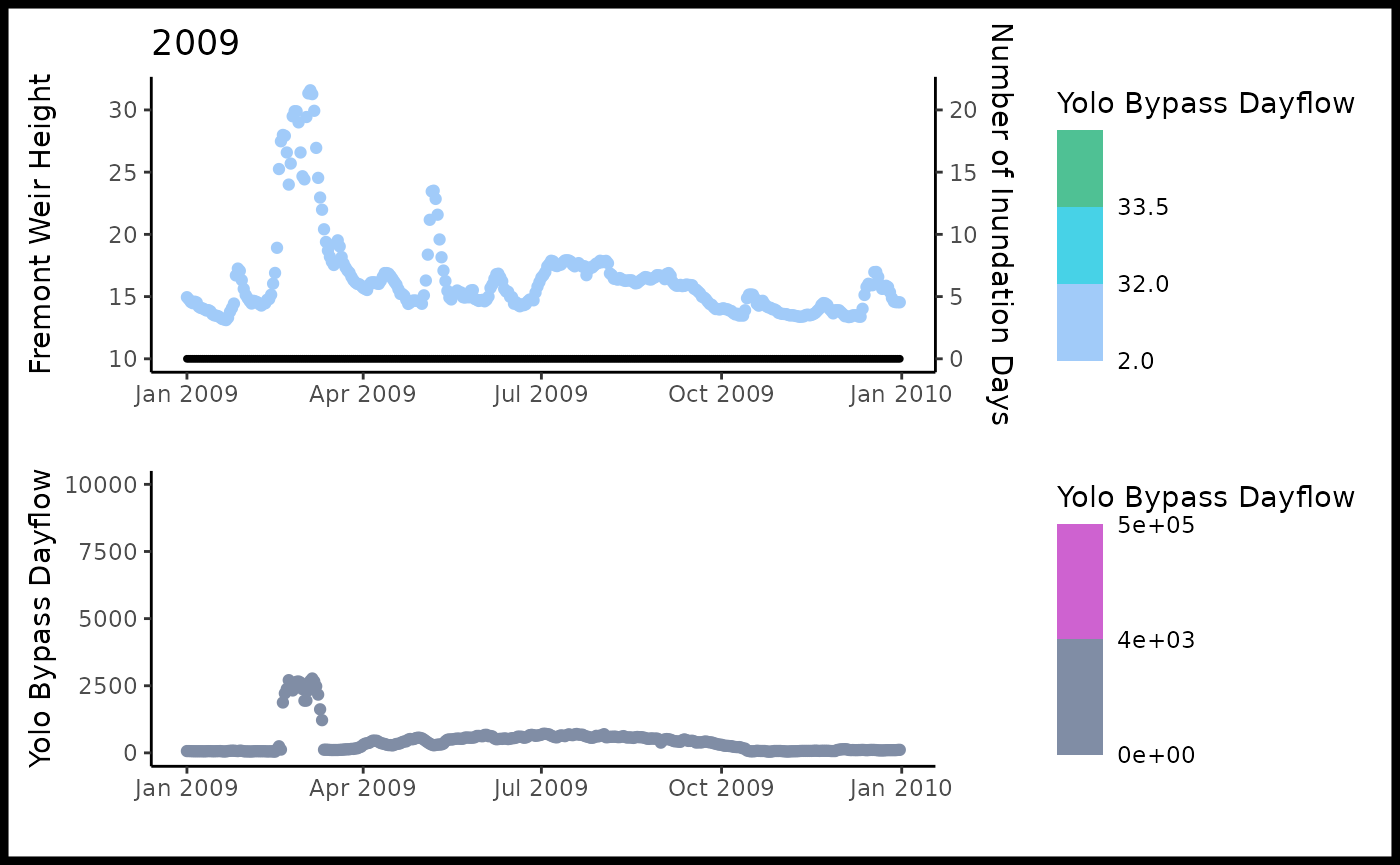
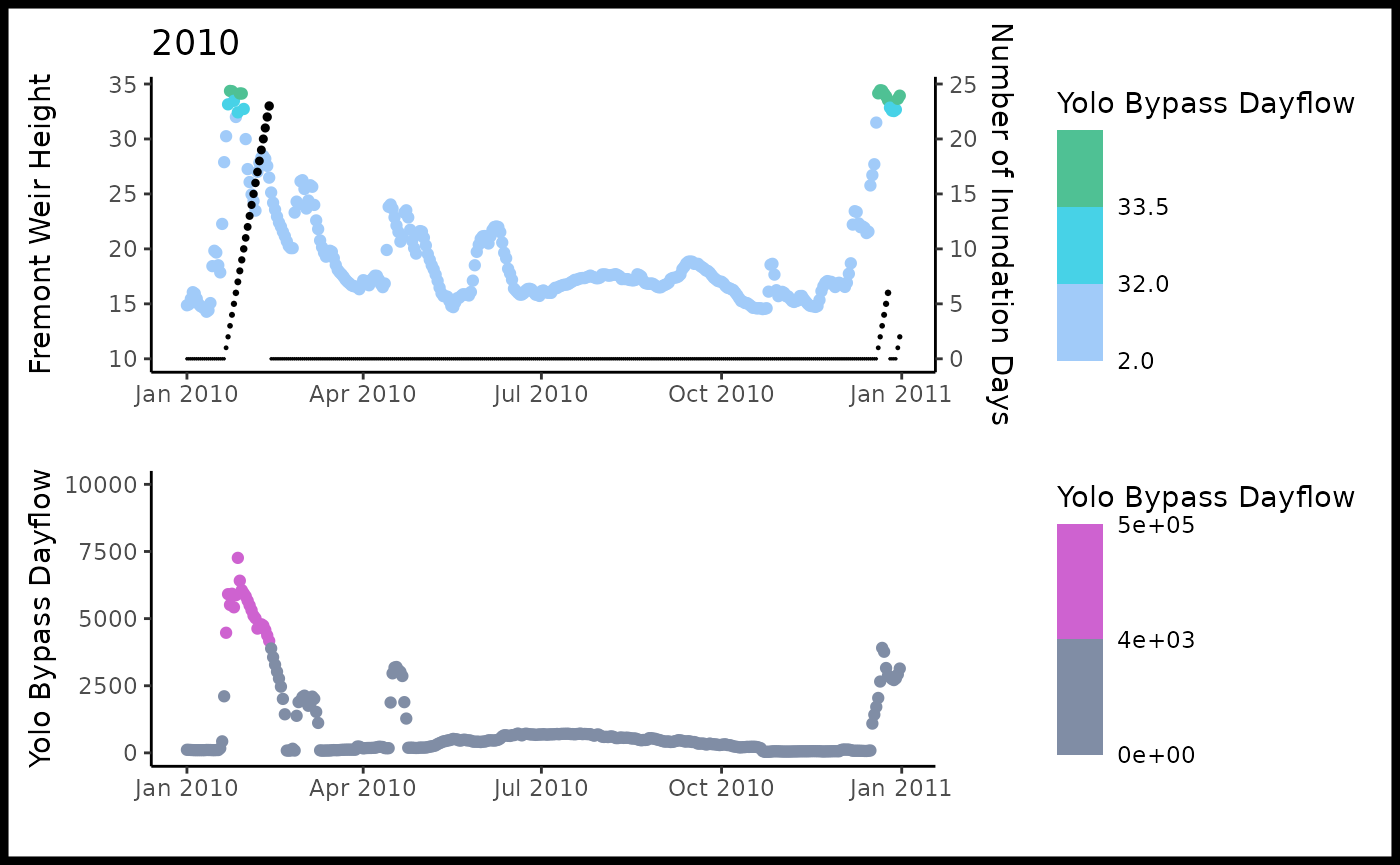
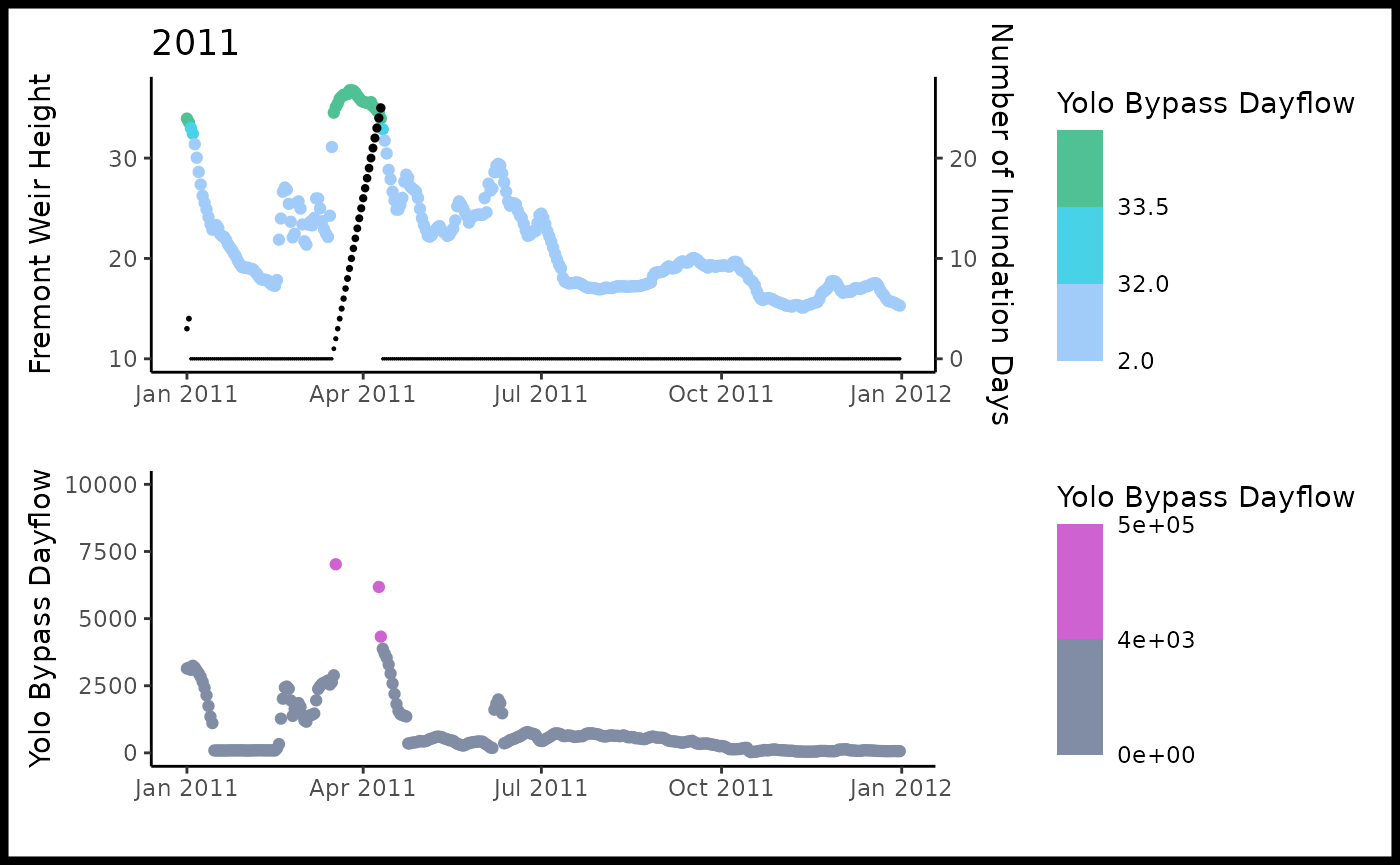
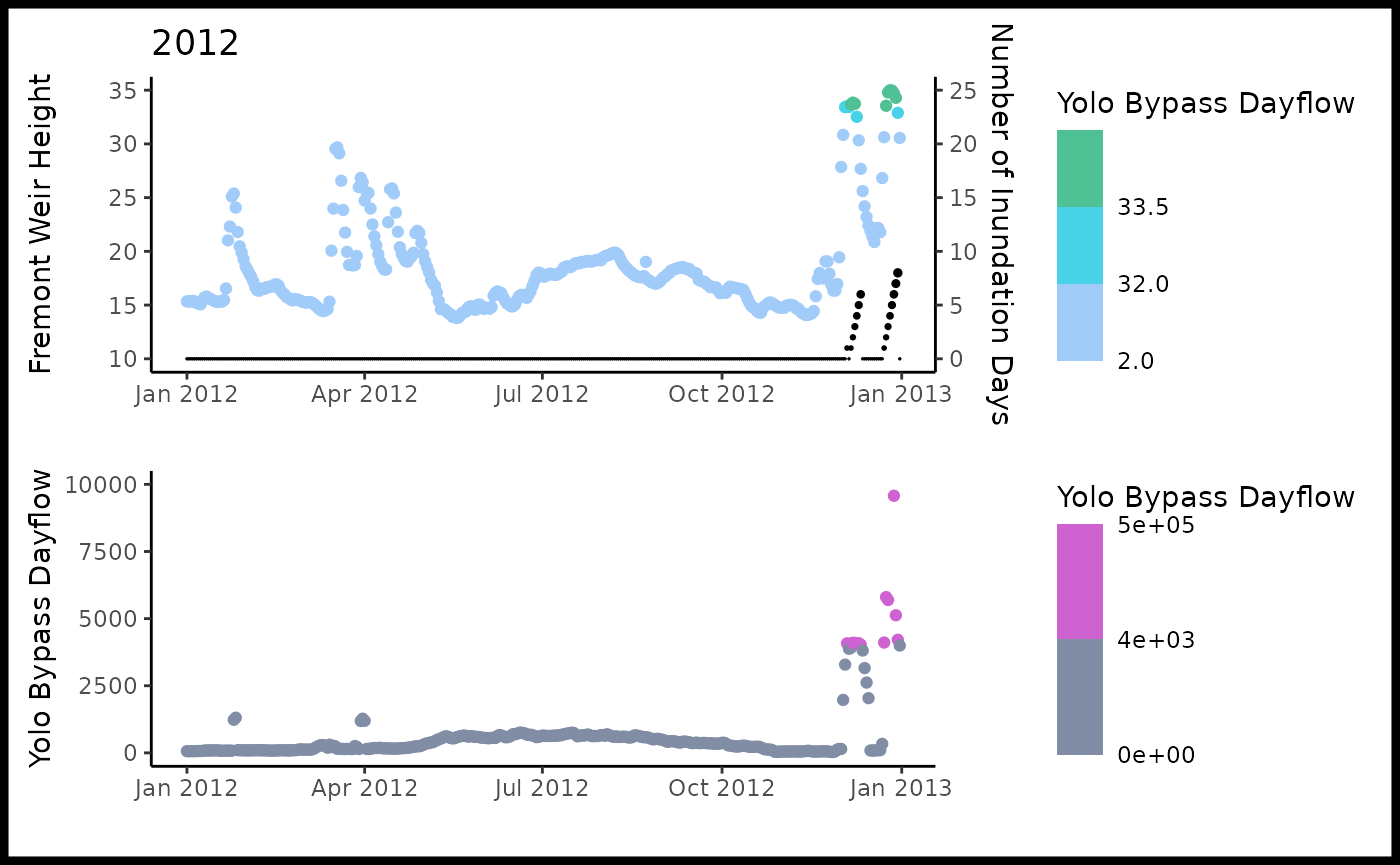
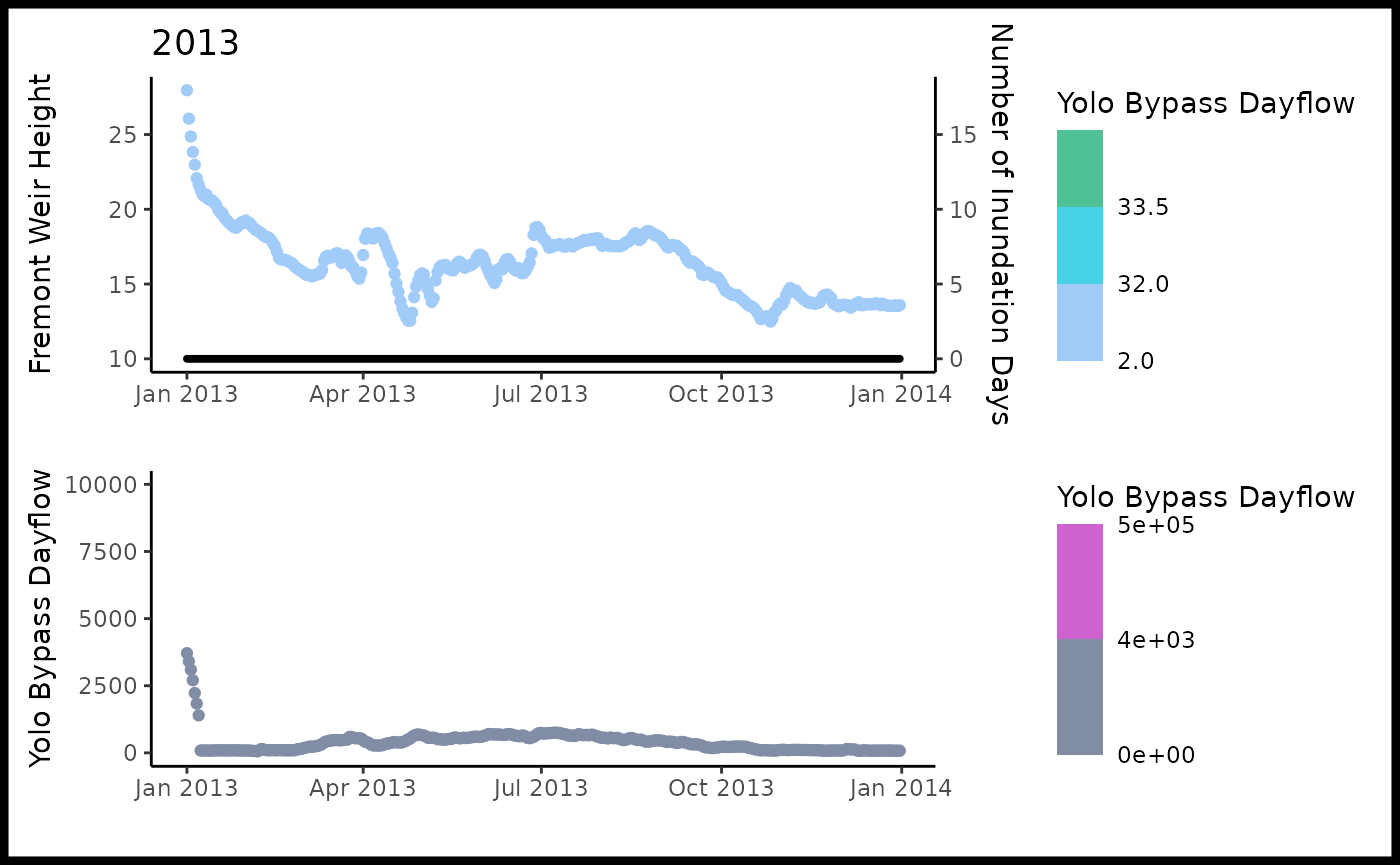
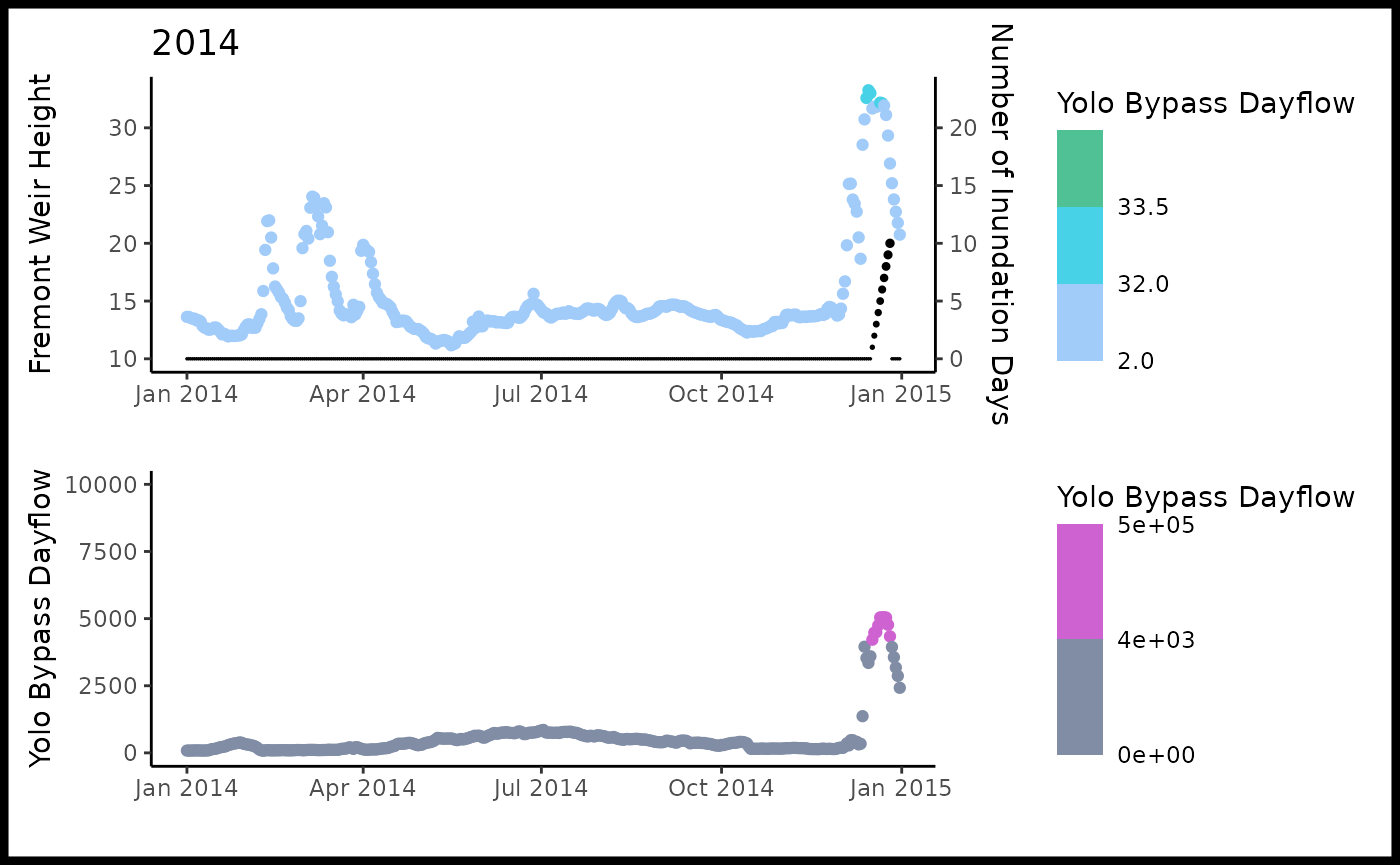
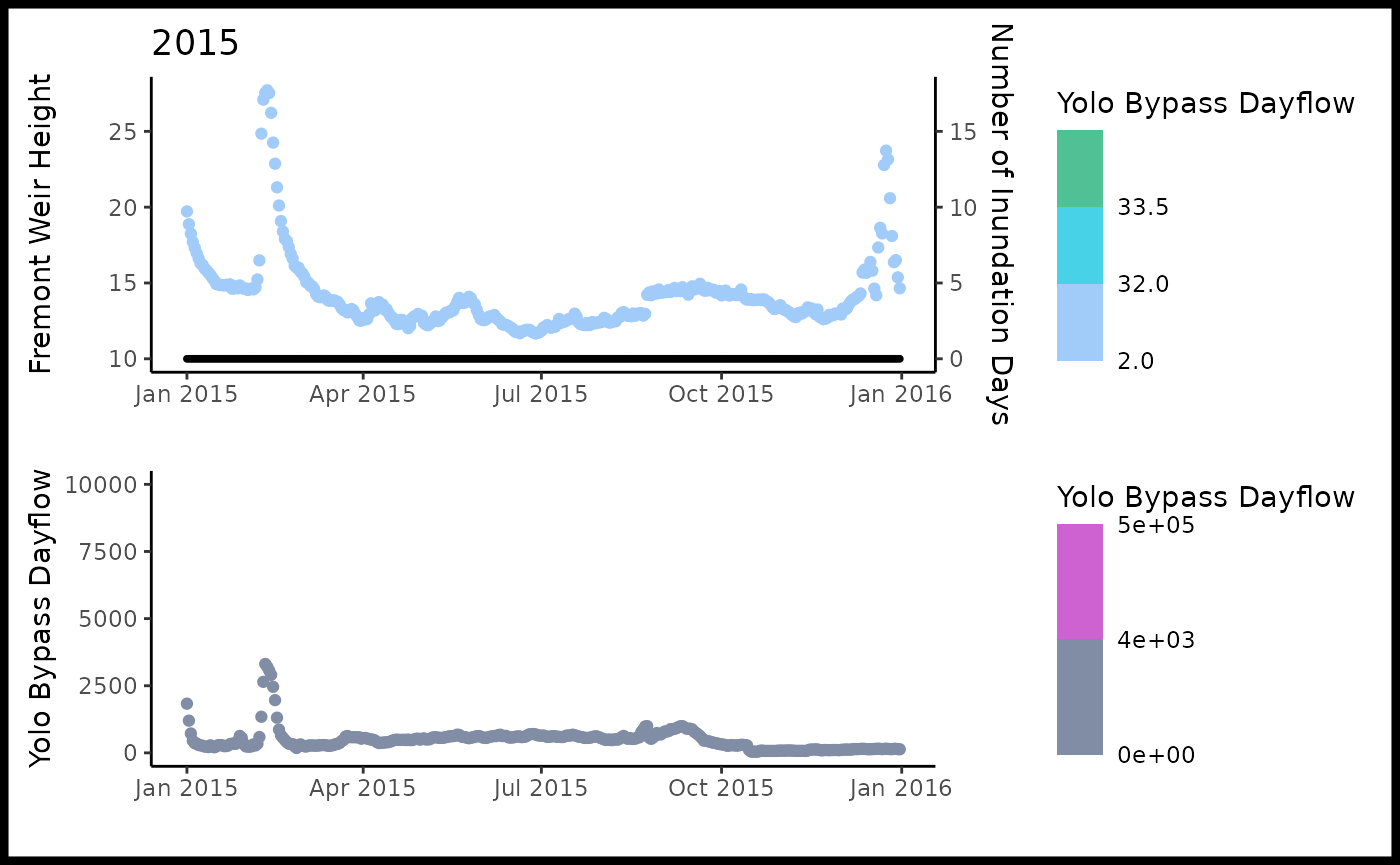
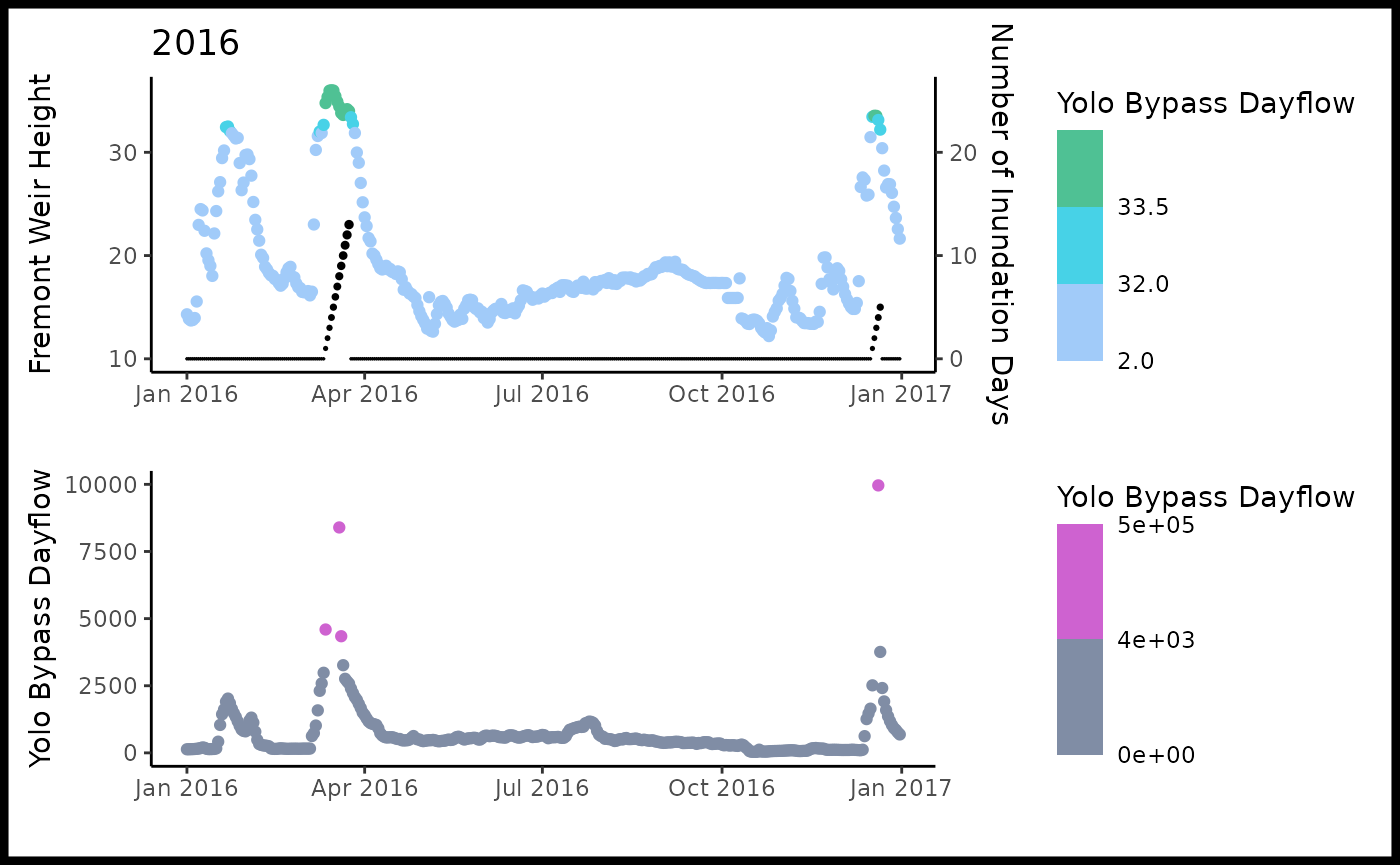
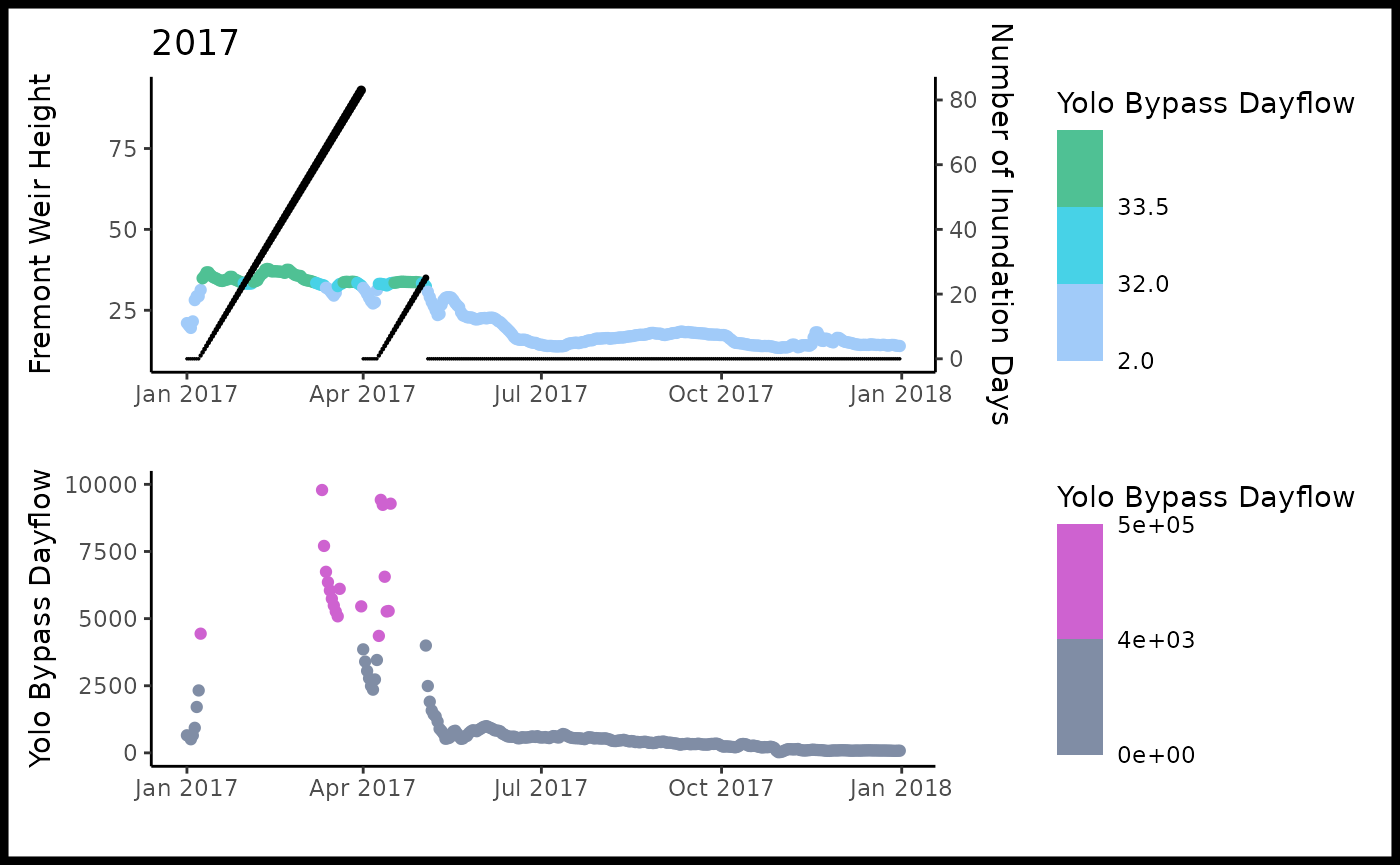
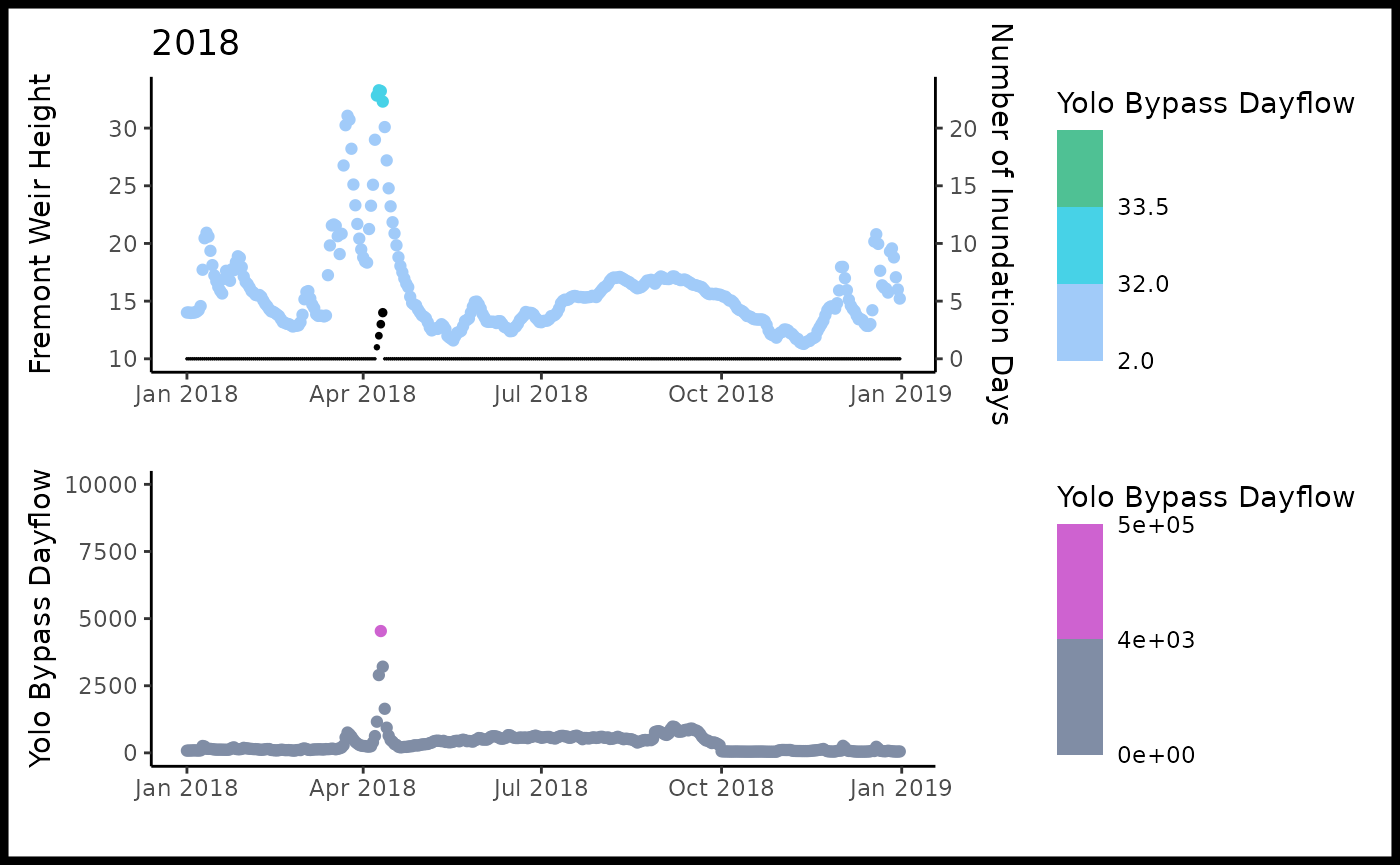
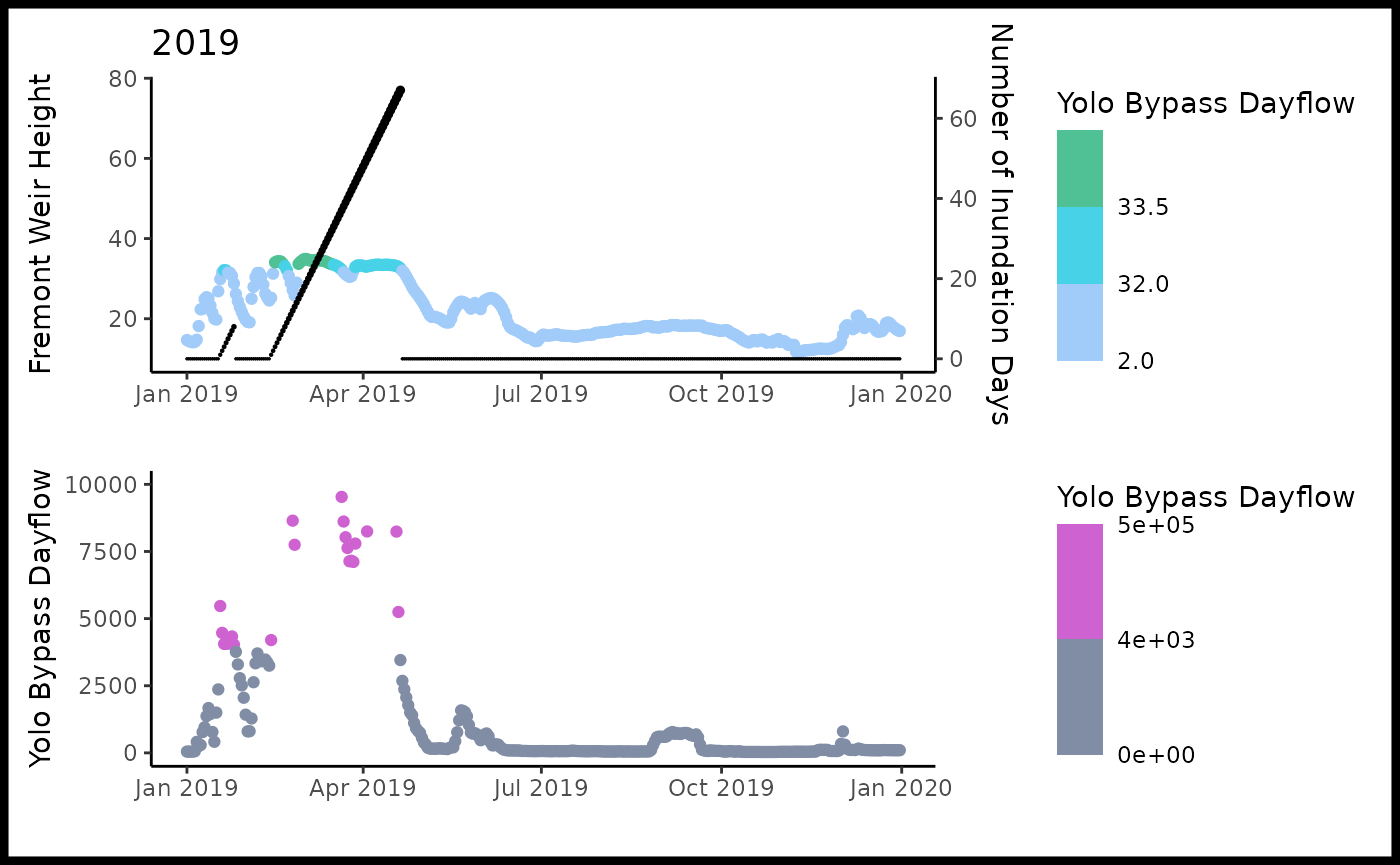
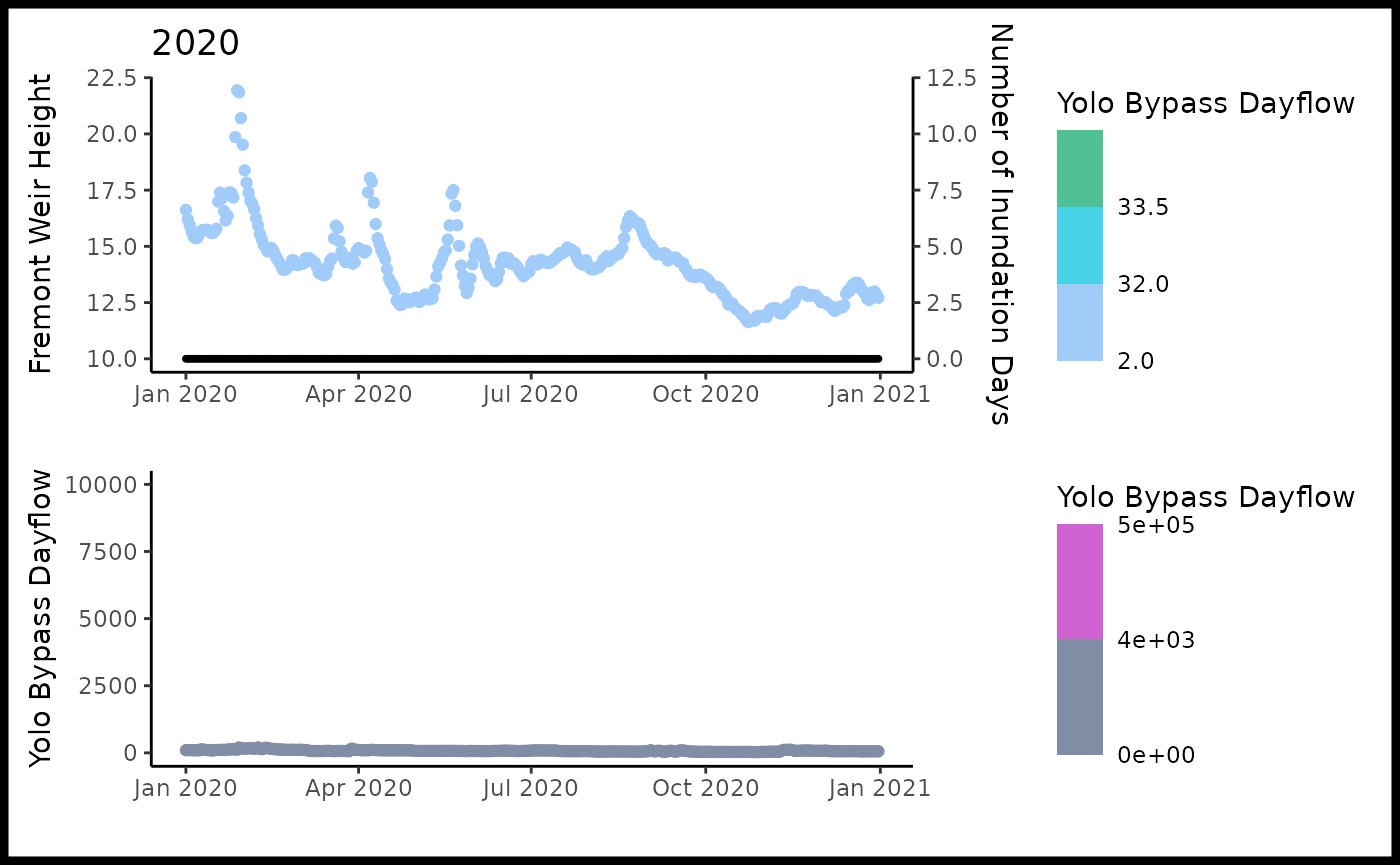
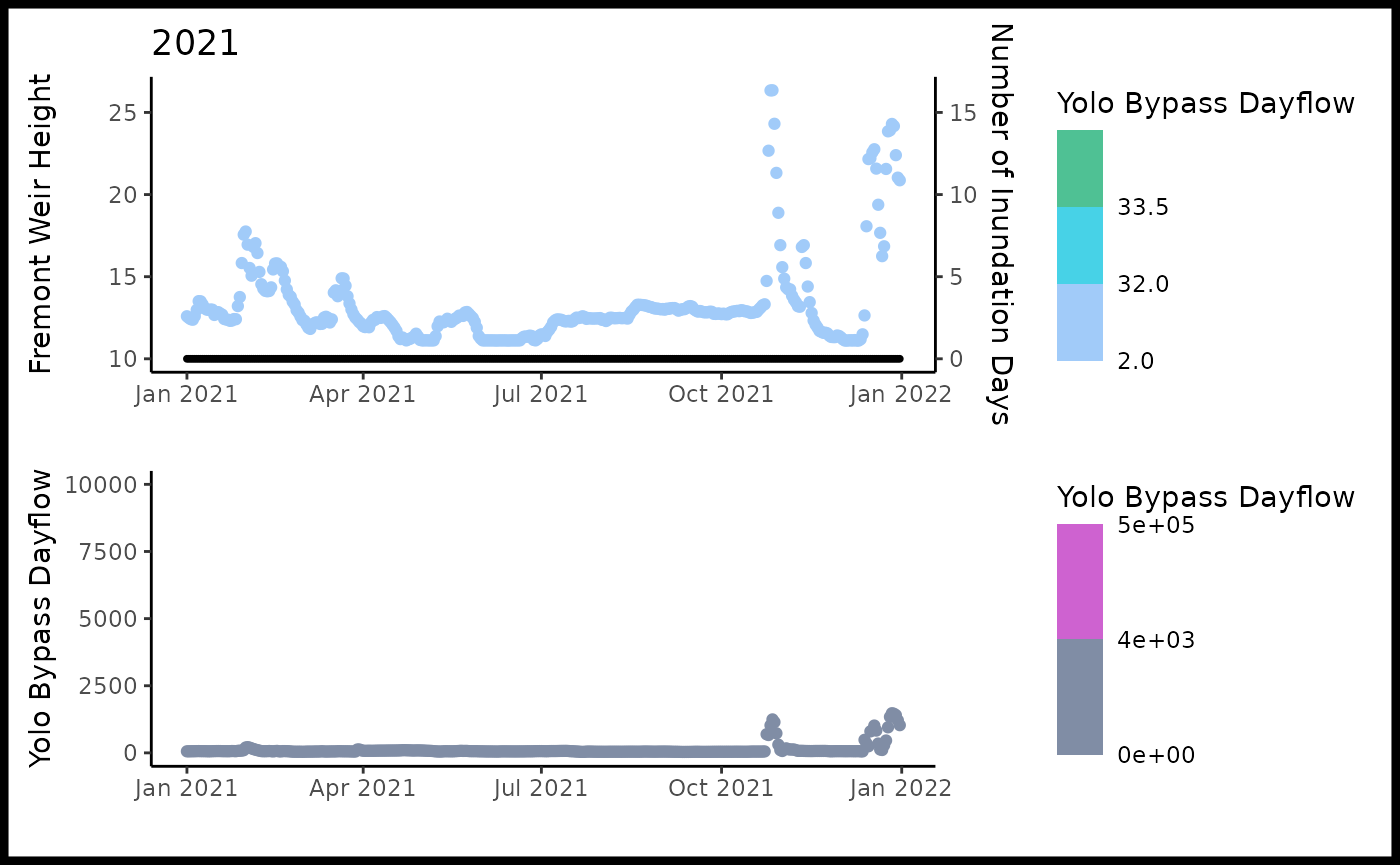
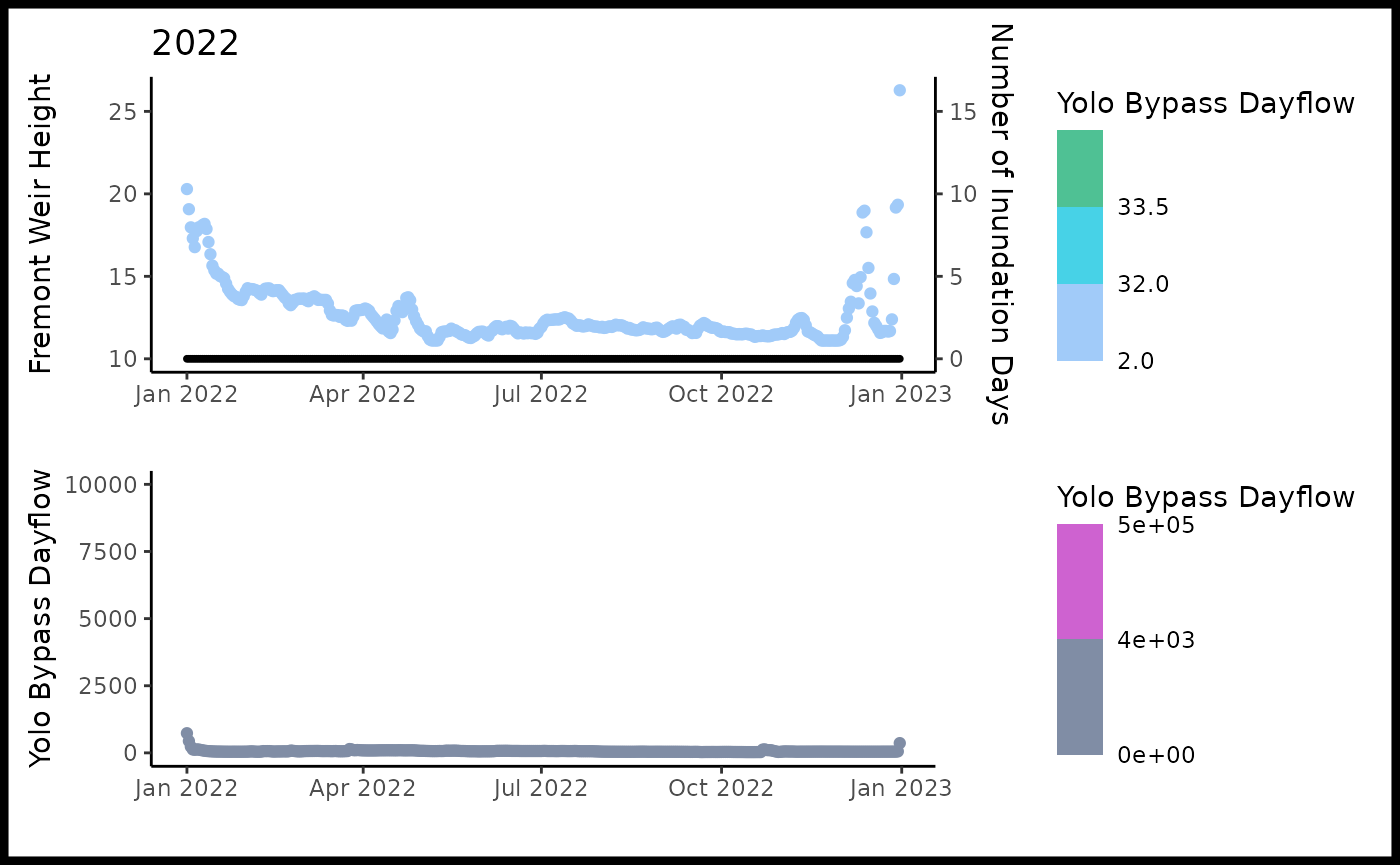
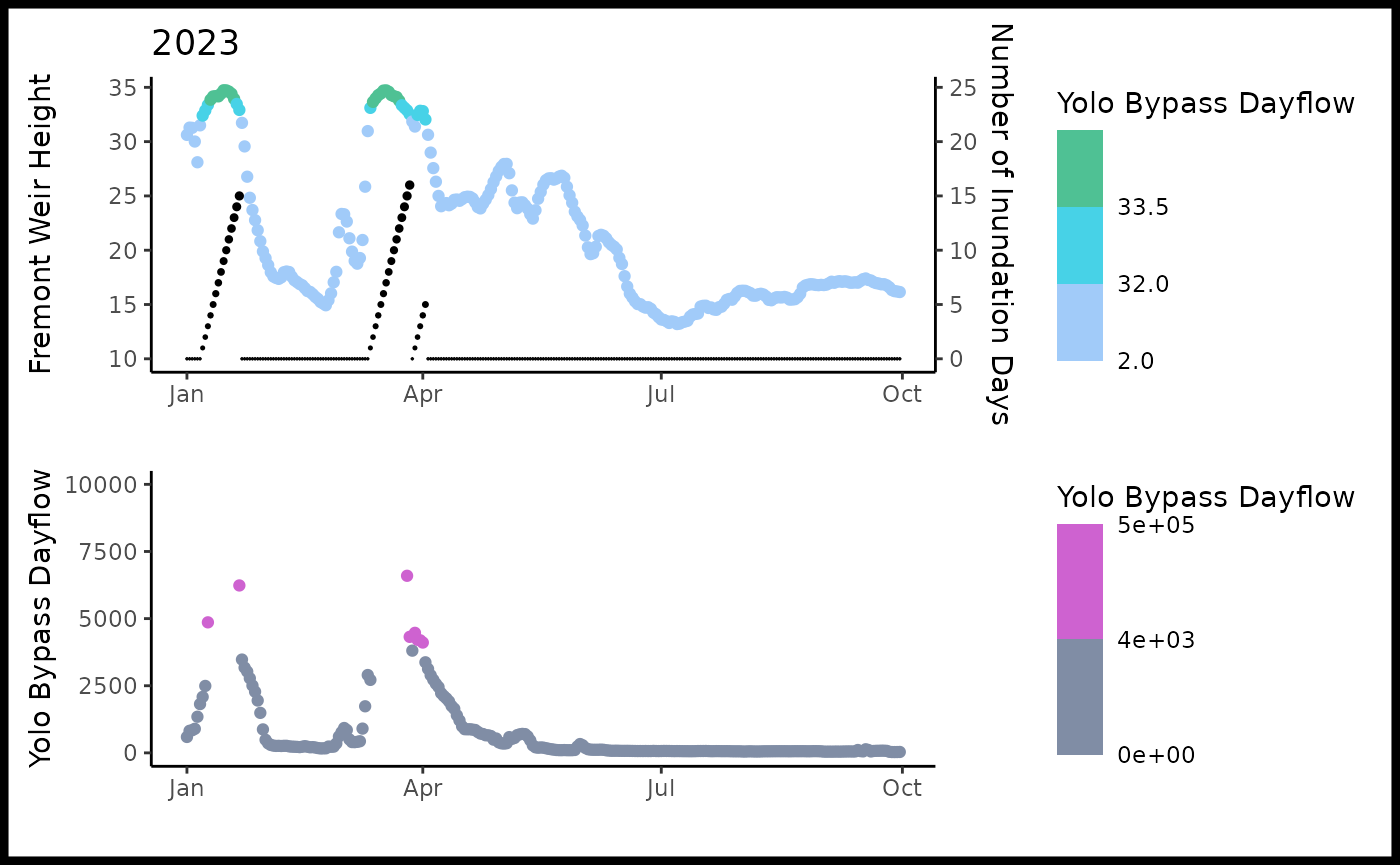
annual_plots.RmdThese plots show annual inundation data, including the Fremont weir height, Yolo bypass dayflow, and the number of inundation days.
Note that strange Sacramento River height values in 1989, 1990 and 1991 (39.98 & 39.91) are ~4 ft higher than any other starting inundation day in the time series. We leave these in the dataset, but users may want to check with CDEC FRE or look into water operations in those years for a possible water transfer.